Spectrum Analyzer Block Diagram:
Spectrum Analyzer Block Diagram – The most common way of observing signals is to display them on an oscilloscope, with time as the X-axis (i.e. amplitude of the signal versus time). This is the time domain. It is also useful to display signals in the frequency domain. The instrument providing this frequency domain view is the spectrum analyzer.
A Spectrum Analyzer Block Diagram provides a calibrated graphical display on its CRT, with frequency on the horizontal axis and amplitude (voltage) on the vertical axis.
Displayed as vertical lines against these coordinates are sinusoidal components of which the input signal is composed. The height represents the absolute magnitude, and the horizontal location represents the frequency.
These instruments provide a display of the frequency spectrum over a given frequency band. Spectrum analyzers use either a parallel filter bank or a swept frequency technique.
In a parallel filter bank analyzer, the frequency range is covered by a series of filters whose central frequencies and bandwidth are so selected that they overlap each other, as shown in Fig. 9.9(a).
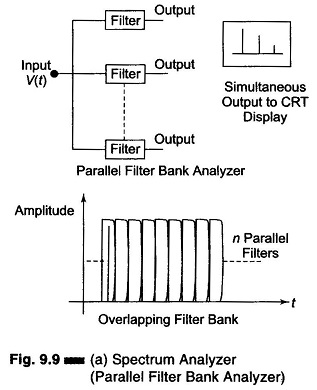
Typically, an audio analyzer will have 32 of these filters, each covering one third of an octave.
For wide band narrow resolution analysis, particularly at RF or microwave signals, the swept technique is preferred.
Basic Spectrum Analyzer Using Swept Receiver Design:
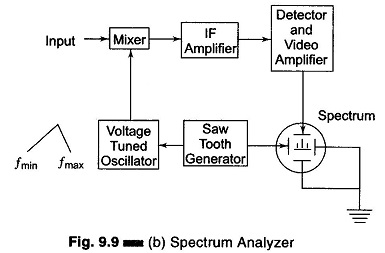
Referring to the block diagram of Fig. 9.9(b), the sawtooth generator provides the sawtooth voltage which drives the horizontal axis element of the scope and this sawtooth voltage is frequency controlled element of the voltage tuned oscillator. As the oscillator sweeps from fmin to fmax of its frequency band at a linear recurring rate, it beats with the frequency component of the input signal and produce an IF, whenever a frequency component is met during its sweep. The frequency component and voltage tuned oscillator frequency beats together to produce a difference frequency, i.e. IF. The IF corresponding to the component is amplified and detected if necessary, and then applied to the vertical plates of the CRO, producing a display of amplitude versus frequency.
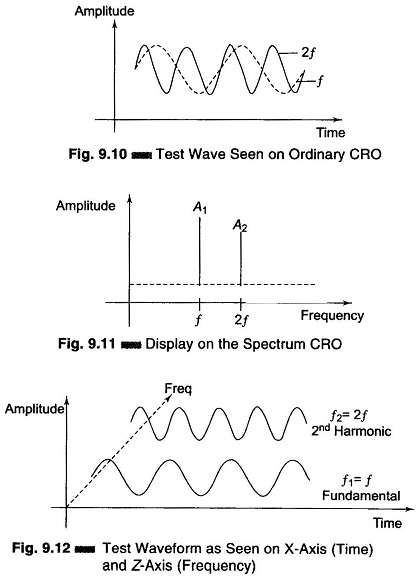
The spectrum produced if the input wave is a single toned A.M. is given in Figs 9.10, 9.11, and 9.12.
Spectrum Analyzer Applications:
One of the principal applications of spectrum analyzers has been in the study of the RF spectrum produced in microwave instruments. In a microwave instrument, the horizontal axis can display as a wide a range as 2 – 3 GHz for a broad survey and as narrow as 30 kHz, for a highly magnified view of any small portion of the spectrum. Signals at microwave frequency separated by only a few kHz can be seen individually.
The frequency range covered by this instrument is from 1 MHz to 40 GHz. The basic block diagram (Fig. 9.13) is of a spectrum analyzer covering the range 500 kHz to 1 GHz, which is representative of a superheterodyne type.
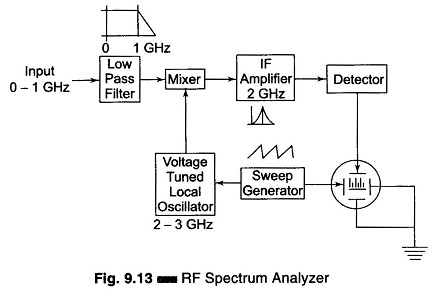
The input signal is fed into a mixer which is driven by a local oscillator. This oscillator is linearly tunable electrically over the range 2 – 3 GHz. The mixer provides two signals at its output that are proportional in amplitude to the input signal but of frequencies which are the sum and difference of the input signal and local oscillator frequency.
The IF amplifier is tuned to a narrow band around 2 GHz, since the local oscillator is tuned over the range of 2 – 3 GHz, only inputs that are separated from the local oscillator frequency by 2 GHz will be converted to IF frequency band, pass through the IF frequency amplifier, get rectified and produce a vertical deflection on the CRT.
From this, it is observed that as the sawtooth signal sweeps, the local oscillator also sweeps linearly from 2 – 3 GHz. The tuning of the spectrum analyzer is a swept receiver, which sweeps linearly from 0 to 1 GHz. The sawtooth scanning signal is also applied to the horizontal plates of the CRT to form the frequency axis. (The Spectrum Analyzer Block Diagram is also sensitive to signals from 4 – 5 GHz referred to as the image frequency of the superheterodyne. A low pass filter with a cutoff frequency above 1 GHz at the input suppresses these spurious signals.) Spectrum analyzers are widely used in radars, oceanography, and bio-medical fields.