Correlation Between Frequency and Transient Response:
As has been stated, the use of frequency response for the design of control systems requires a Correlation Between Frequency and Transient Response. Time response specifications are available for the performance of a system. These must be translated to frequency response. There must be frequency domain specifications also, corresponding to the time domain specifications, such as overshoot, settling time, etc. However, it is easy to have a direct Correlation Between Frequency and Transient Response of a second order system. A typical magnitude plot of a second order system is shown in Fig. 6.17.
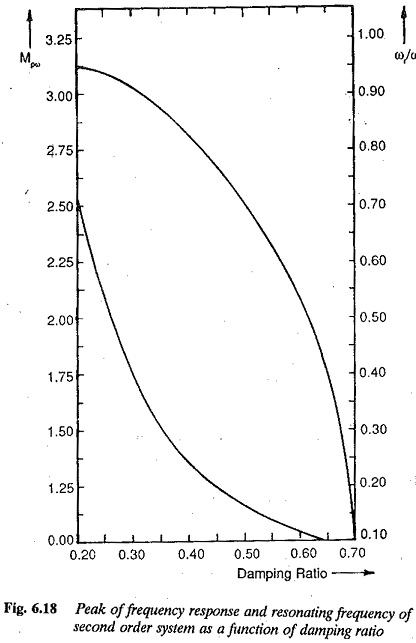
The resonant peak (maximum amplitude) MPω of the magnitude plot depends upon the damping ratio of the system. The resonant frequency also depends upon the damping ratio. These relations are given by Eqs 6.59 and 6.60 and represented graphically in Fig. 6.18. The resonant frequency ωr and band width of the frequency response relate to the fastness of response. Smaller the values of bandwidth and resonant frequency smaller is the rise time of the transient response and faster is the response. The overshoot of the time response can be related to the resonant peak of the frequency response. This resonant peak also indicates the relative stability of the systems. The bandwidth is related to the natural frequency ωn of the system. For a given ξ greater the value ωn faster is the response. The value of ξ must be chosen to compromise between Mpω and ωr.
The frequency domain specifications are therefore
1.The peak amplitude and the frequency at which this occurs. The peak amplitude must be normally less than 1.5. The acceptable range of peak amplitude corresponds to damping rates of 0.4 to 0.7.
2.Relatively large resonant frequency and hence large bandwidth of the frequency response. The system will have relatively small time constants. The system becomes faster.
3.The closeness of the polar plot of frequency response to (-1, 0) point indicates the peak overshoot of the time response. This also gives the relative
4.The steady-state error can be related to frequency response also. The gain and number of integrations involved in the open loop system indicate the influence of steady-state error.
The Correlation Between Frequency and Transient Response of higher order systems is not so simple and straightforward as it is for second order systems. The mathematical treatment of higher order systems for such a correlation is rather involved and laborious. However, a higher order system can be represented by a second order system if it has a pair of dominant complex conjugate poles. The frequency and time responses of this system is influenced by this pair of dominant poles. In such a case the Correlation Between Frequency and Transient Response for a second order system can be very easily extended for higher order systems.
For higher order systems having a dominant pair of complex conjugate poles, the following correlation exists between the transient and frequency responses:
1.The peak magnitude of frequency response indicates the relative stability. A system having a peak amplitude in the range of 1 to 1.4 would have a time response with an effective damping ratio in the range of 0.4 to 0.7.
2.If the peak amplitude of the frequency response is greater than 1.5 the time response is oscillatory, having a large overshoot.
3.The resonant frequency, i.e. the frequency corresponding to peak amplitude, is a measure of the fastness of response. Larger the value of resonant frequency, faster is the response, i.e. the smaller is the rise time.
4.The system is highly damped if the resonant frequency and damped natural frequency are close to each other.
5.Larger values of to ωr characterize larger bandwidth. However, in view of the noise the system should not have large bandwidth. Larger the bandwidth costlier is the system. A compromise is required.
6.Cut off frequency (frequency at which the amplitude is 3 db below the zero frequency value) characterises the filtering characteristics of high frequency
7.The slope of the log-magnitude curves known as cut off rate gives the ability of the control system to distinguish between noise and signal.
Using the above correlation, the time domain specifications can be translated to frequency domain specifications. The design of the control system is carried out in the frequency domain to meet the required specifications.