Polar Plot for Frequency Response:
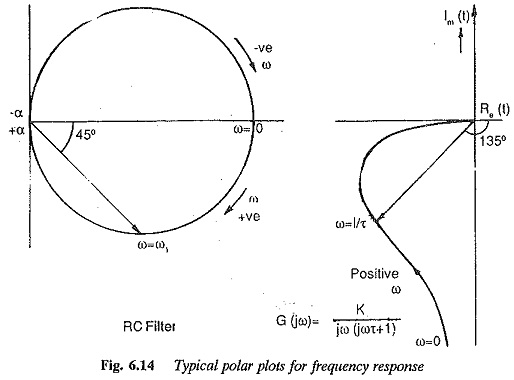
One of them is the Polar Plot for Frequency Response representation. The transfer function in the frequency domain is obtained by substituting jω for s as complex function of ω. It is separated into real and imaginary parts which are plotted on the real and imaginary axes to get the locus on the complex plane as ω is varied. It is also possible to transform the complex function into its polar form having magnitude and phase. For example
A typical Polar Plot for Frequency Response is shown in Fig. 6.14. It can be very easily seen that this kind of representation has a limitation. The investigation of the effects of changing parameters or adding poles or zeros to the existing transfer function requires recalculation of frequency response. The adjustment of parameters for the desired performance is rather tedious. The effects of individual poles or zeros are not separately indicated by the method.
Another method of portraying the frequency response, which is relatively simple and is widely used, is to represent separately the magnitude and phase of the transfer functions as functions of logarithmic frequency. These frequency response plots are called Bode Plot for Frequency Response. We know that for a given transfer function
where
Z(ω) is the magnitude and
Φ(ω) is the phase
The natural logarithm is
The log magnitude transformed to the base 10 becomes
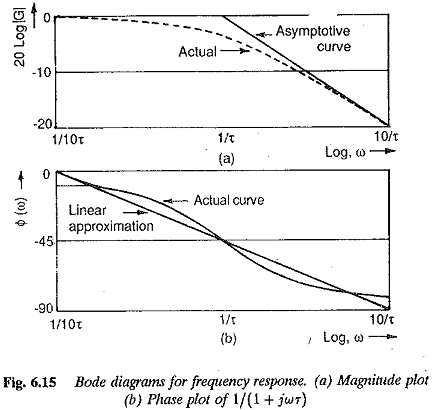
The logarithmic magnitude (gain) and phase angle are drawn as functions of frequency on a separate set of axes. The frequency is represented on a logarithmic scale as it is the most convenient one for this case. By this magnitude the plot becomes a plot of asymptotic lines, each of which has a slope —20 db/decade of frequencies.
An immediate advantage that follows from these plots is that all the multiplicative factors become additive ones. Therefore, by drawing the plots of individual factors and adding them we get the frequency response plot of the overall transfer function. Figure 6.15 gives the summary of the Bode Plot for Frequency Response of the important basic functions.
However the frequency response of a second order system cannot always be represented by a pair of asymptotic lines. The transfer function of a typical second order system in the complex frequency plane is given by
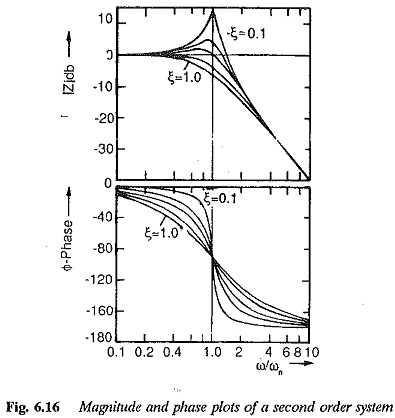
The magnitude and phase plots are shown in Fig. 6.16. From these plots it is very clear that the log-magnitude and phase plots of a second order system depend very much on the damping ratio. The system may be represented by asymptotic lines if ξ > 0.707. The deviation of actual response from the asymptotic one is a function of e and must be taken into consideration if ξ < 0.707. The frequency at which the peak value of magnitude (Mpu) occurs is called resonant frequency ω. A Relationship between ω and ω can be derived as
As the damping factor approaches zero, the value of ωr approaches ωn. The peak value of response is also related to ξ as
Mpu is unity for ξ = 0.707. A clear value of ωr at which Mpu > 1 can be identified for ξ > 0.707. As ξ approaches zero the value Mpu approaches infinity. These relations are shown graphically in Fig. 6.16. The phase of the transfer function at resonant frequency is given by
We discussed and concluded in the previous section that a higher order system having a dominant pair of complex conjugate poles can be represented by an equivalent second order system. These relations are useful for determining the damping ratio for experimental frequency response.
From the above discussion it is clear that a second order system cannot always be represented by asymptotic approximation. In terms of e we decided when this would be feasible. It is also helpful to decide the ratios of time constants of the system at which this approximation would be feasible. To solve this problem let us consider the normalised transfer function of a second order system in the frequency domain as
Let us investigate the errors involved in representing this by two first order delays
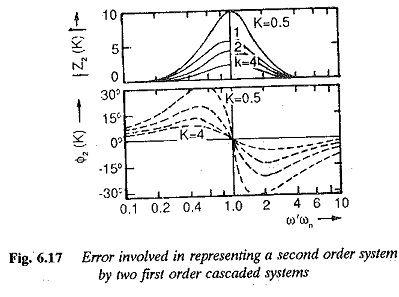
From this Z2(jω) is the error involved and it provides the correction required when Z(jω) is approximated by Z1(jω). Let us investigate for what ratios of Tm/TA the approximation is feasible. Assuming Tm/TA = t and introducing a variable K=TA√t . (jω) we have the transfer function relating to the error
The magnitude and phase Z2 as function of K are shown in Fig. 6.17. From the figure it is clear that the error in magnitude as well as phase plots increases as the value of t decreases. For larger values of t the deviation of the asymptotic approximation from the actual response becomes negligible and Z2(K) = 1. Thus the ratio of Tm/TA decides whether the approximation would be valid or not.
The following procedure may be adopted for drawing the log-magnitude and phase plots to represent the frequency response:
1.Identify the corner frequencies of the factors of the sinusoidal transfer
2.Draw the asymptotic log-magnitude curves with proper slopes at corner
3.The proper corrections are made to these asymptotic curves to arrive at the exaet curve.
4.The phase angle plot is obtained by adding the individual phase angle curves of the factors.
The advantages of this method are obvious. It takes much less time to draw these curves compared to the other methods used for determining the frequency response. The curves of a given transfer function can be easily modified to take into account addition of poles and zeros for improving the performance. Once one becomes used to these plots, the composite asyrimtotic plot can be directly drawn doing the summing process mentally.


