Wheatstone Bridge Diagram:
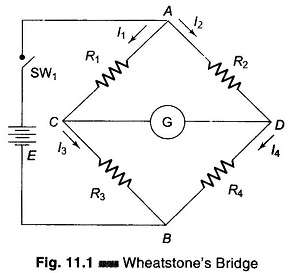
A Wheatstone Bridge diagram in its simplest form consists of a network of four resistance arms forming a closed circuit, with a dc source of current applied to two opposite junctions and a current detector connected to the other two junctions, as shown in Fig. 11.1.
Wheatstone Bridge diagram are extensively used for measuring component values such as R, L and C. Since the bridge circuit merely compares the value of an unknown component with that of an accurately known component (a standard), its measurement accuracy can be very high. This is because the readout of this comparison is based on the null indication at bridge balance, and is essentially independent of the characteristics of the null detector. The measurement accuracy is therefore directly related to the accuracy of the bridge component and not to that of the null indicator used.
The basic dc bridge is used for accurate measurement of resistance and is called Wheatstone’s bridge.
Wheatstone Bridge Circuit (Measurement of Resistance):
Wheatstone’s bridge is the most accurate method available for measuring resistances and is popular for laboratory use. The circuit diagram of a typical Wheatstone Bridge diagram is given in Fig. 11.1. The source of emf and switch is connected to points A and B, while a sensitive current indicating meter, the galvanometer, is connected to points C and D. The galvanometer is a sensitive microammeter, with a zero centre scale. When there is no current through the meter, the galvanometer pointer rests at 0, i.e. mid scale. Current in one direction causes the pointer to deflect on one side and current in the opposite direction to the other side.
When SW1 is closed, current flows and divides into the two arms at point A, i.e. I1 and I2. The bridge is balanced when there is no current through the galvanometer, or when the potential difference at points C and D is equal, i.e. the potential across the galvanometer is zero.
To obtain the bridge balance equation, we have from the Fig. 11.1.
![]()
For the galvanometer current to be zero, the following conditions should be satisfied.
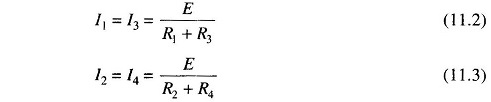
Substituting in Eq. (11.1)
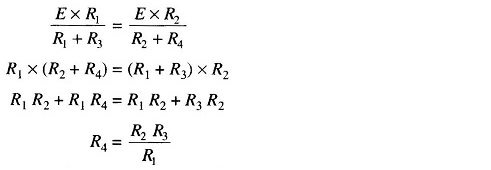
This is the equation for the bridge to be balanced.
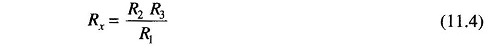
In a practical Wheatstone Bridge diagram, at least one of the resistance is made adjustable, to permit balancing. When the bridge is balanced, the unknown resistance (normally connected at R4) may be determined from the setting of the adjustable resistor, which is called a standard resistor because it is a precision device having very small tolerance.
Hence
Sensitivity of a Wheatstone Bridge:
When the bridge is in an unbalanced condition, current flows through the galvanometer, causing a deflection of its pointer. The amount of deflection is a function of the sensitivity of the galvanometer. Sensitivity can be thought of as deflection per unit current. A more sensitive galvanometer deflects by a greater amount for the same current. Deflection may be expressed in linear or angular units of measure, and sensitivity can be expressed in units of S = mm/μA or degree/µA or radians/μA.
Therefore it follows that the total deflection D is D = S x 1, where S is defined above and I is the current in microamperes.
Unbalanced Wheatstone’s Bridge:
To determine the amount of deflection that would result for a particular degree of unbalance, general circuit analysis can be applied, but we shall use Thevenin’s theorem.
Since we are interested in determining the current through the galvanometer, we wish to find the Thevenin’s equivalent, as seen by the galvanometer.
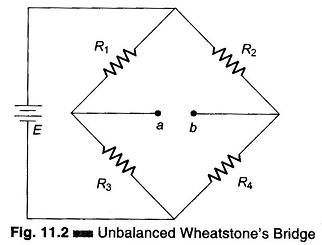
Thevenin’s equivalent voltage is found by disconnecting the galvanometer from the Wheatstone Bridge diagram, as shown in Fig. 11.2, and determining the open-circuit voltage between terminals a and b.
Applying the voltage divider equation, the voltage at point a can be determined as follows

Therefore, the voltage between a and b is the difference between Ea and Eb, which represents Thevenin’s equivalent voltage.

Therefore

Thevenin’s equivalent resistance can be determined by replacing the voltage source E with its internal impedance or otherwise short-circuited and calculating the resistance looking into terminals a and b. Since the internal resistance is assumed to be very low, we treat it as 0 Ω. Thevenin’s equivalent resistance circuit is shown in Fig. 11.3.
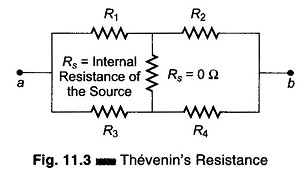
The equivalent resistance of the circuit is R1//R3 in series with R2//R4 i.e. R1//R3 + R2//R4.

Therefore, Thevenin’s equivalent circuit is given in Fig. 11.4. Thevenin’s equivalent circuit for the bridge, as seen looking back at terminals a and b in Fig. 11.2, is shown in Fig. 11.4.
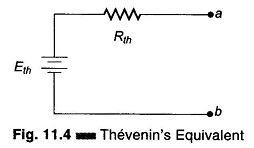
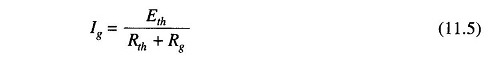
If a galvanometer is connected across the terminals a and b of Fig.11.2, or its Thevenin equivalent Fig. 11.4 it will experience the same deflection at the output of the bridge. The magnitude of current is limited by both Thevenin’s equivalent resistance and any resistance connected between a and b. The resistance between a and b consists only of the galvanometer resistance Rg. The deflection current in the galvanometer is therefore given by
Slightly Unbalanced Wheatstone’s Bridge:
If three of the four resistor in a bridge are equal to R and the fourth differs by 5% or less, we can develop an approximate but accurate expression for Thevenin’s equivalent voltage and resistance.
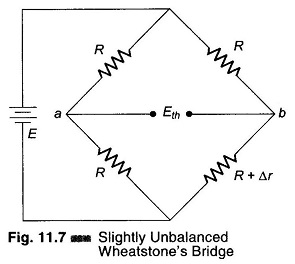
Consider the circuit in Fig. 11.7.
The voltage at point a is

The voltage at point b is

Thevenin’s equivalent voltage between a and b is the difference between these voltages.
Therefore
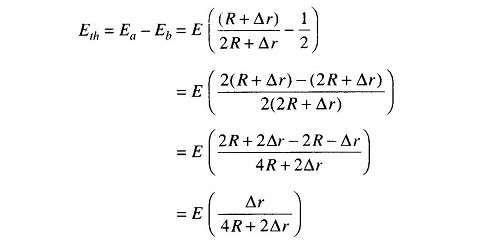
If Δ r is 5% of R or less, Δ r in the denominator can be neglected without introducing appreciable error. Therefore, Thevenin’s voltage is

The equivalent resistance can be calculated by replacing the voltage source with its internal impedance (for all practical purpose short-circuit). The Thevenin’s equivalent resistance is given by
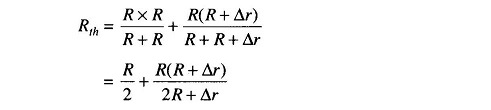
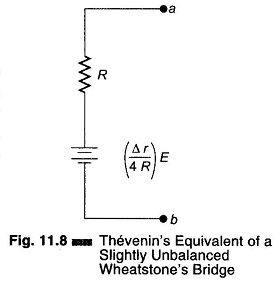
Again, if Δr is small compared to R, Δ r can be neglected. Therefore,

Using these approximations, the Thevenin’s equivalent circuit is as shown in Fig. 11.8. These approximate equations are about 98% accurate if Δr ≤ 0.05 R.
Application of Wheatstone’s Bridge:
A Wheatstone bridge may be used to measure the dc resistance of various types of wire, either for the purpose of quality control of the wire itself, or of some assembly in which it is used. For example, the resistance of motor windings, transformers, solenoids, and relay coils can be measured.
Wheatstone Bridge diagram is also used extensively by telephone companies and others to locate cable faults. The fault may be two lines shorted together, or a single line shorted to ground.
Limitations of Wheatstone’s Bridge:
For low resistance measurement, the resistance of the leads and contacts becomes significant and introduces an error. This can be eliminated by Kelvin’s Double bridge.
For high resistance measurements, the resistance presented by the bridge becomes so large that the galvanometer is insensitive to imbalance. Therefore, a power supply has to replace the battery and a dc VTVM replaces the galvanometer. In the case of high resistance measurements in mega ohms, the Wheatstone’s bridge cannot be used.
Another difficulty in Wheatstone Bridge diagram is the change in resistance of the bridge arms due to the heating effect of current through the resistance. The rise in temperature causes a change in the value of the resistance, and excessive current may cause a permanent change in value.