Measuring Amplitude Modulation Using CRO:
The CRO is widely used as an Measuring Amplitude Modulation. It presents the waveform for visual monitoring and is fairly accurate in measurements of modulation percentage. The type of CRO pattern observed depends on how the CRO is connected. The various patterns obtained are
(i) wave envelope
(ii) trapezoidal, and
(iii) a double ellipse.
Wave Envelope Pattern
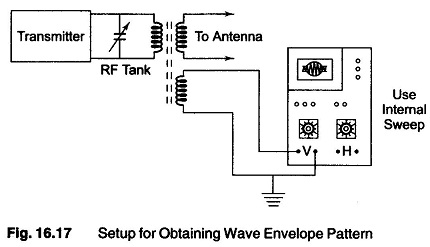
The wave envelope pattern is obtained by using the CRO sawtooth sweep voltage on the H-plates and applying the RF signal to the vertical plates. The setup for this measurement is illustrated in Fig. 16.17.
In order to obtain actual measurements, it is necessary to obtain a stationary pattern. This occurs only when the sweep frequency is the same as the modulation frequency or some sub-multiple of it. At 100% modulation, the peak of the modulating carrier is twice the amplitude of the unmodulated carrier; the minimum amplitude reaches zero but does not remain there for a significant period of time. This waveform is shown in Fig. 16.18.
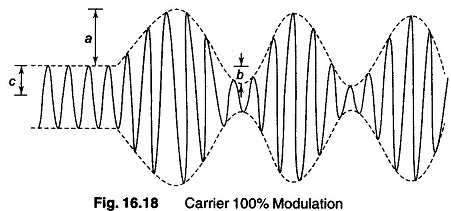
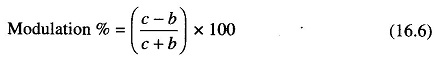
The modulating signal in this case is a symmetrical sine wave. With 100% modulation, amplitudes a, b and c are all equal. With any symmetrical wave, the percentage of modulation is equal to either a or b divided by c. If the modulating wave is not symmetrical, a and b will be of different amplitudes. In this case, the larger of the two amplitudes is divided by c to obtain the percentage of modulation.16.13.2 Trapezoidal PatternTrapezoidal patterns may be obtained using the modulating signal on the horizontal deflecting plates and a modulated carrier wave on the vertical plates.The basic setup and the possible patterns are shown in Fig. 16.19 and Fig. 16.20.
Trapezoidal Pattern
Trapezoidal patterns may be obtained using the modulating signal on the horizontal deflecting plates and a modulated carrier wave on the vertical plates.The basic setup and the possible patterns are shown in Fig. 16.19 and Fig. 16.20.
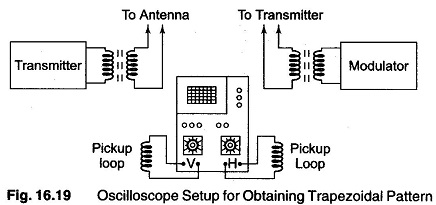
The pattern shown in Fig. 16.20, is the unmodulated carrier and the carrier with a different percentage of modulation. The amplitude of modulated carrier (a) is a reference to illustrate amplitude changes due to the modulating signal. The narrow end (b) of the trapezoidal pattern represents the modulation troughs, and the wide end (c) represents the modulation peaks. These amplitude need not be reduced to voltage measurements; the number of divisions of the deflection is sufficient for calculations. The percentage modulation may be calculated as
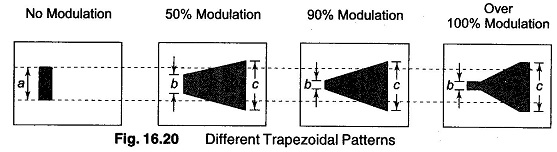
With 50% modulation, the ratio between minimum and maximum amplitudes is 1:3, regardless of the divisions used.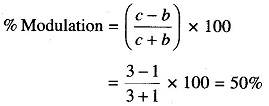
In the case of 100% modulation, the narrow end of the trapezoidal pattern flattens out, becomes elongated and grows brighter than the remainder of the pattern. This indicates that the minimum amplitude is going all the way down to 0 and remaining their for a finite period of time. If the maximum amplitude is checked against the unmodulated carrier amplitude under these conditions, it will be more than twice the amplitude of the unmodulated carrier.
Double Ellipse Method
A double ellipse pattern for measuring amplitude modulation can be obtained by connecting the oscilloscope into the receiver circuit, as shown in Fig. 16.21(a).
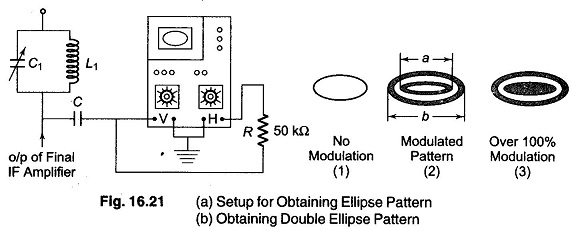
An ellipse consisting of a single sharply defined line is produced by the unmodulated carrier. The shape is due to the phase difference between the signals applied to the H and V deflection plates. The phase shift is obtained by the 50 kΩ resistor, along with the input capacitor in the Horizontal amplifier of the oscilloscope.
When the carrier is modulated, the pattern becomes a double ellipse in a ribbon pattern. Any degree of modulation less than 100% will produce a blank spot inside the centre ellipse. As the percentage of modulation increases, the centre blank space decreases, and it completely disappears at 100% modulation. Over 100% modulation causes a bright spot to appear in the centre ellipse.Distance a in Fig. 16.21(b), represents the minimum amplitude, while distance b represents the maximum amplitude.
% modulation is calculated as follows:
![]()
The ratio of a to b in the figure is 1 : 2, which represents about 33% modulation.