Phasor Diagram of Synchronous Motor:
The Phasor Diagram of Synchronous Motor is the most important element of a power system. It converts mechanical power into electrical form and feeds it into the power network or, in the case of a motor, it draws electrical power from the network and converts it into the mechanical form. The machine excitation which is controllable determines the flow of VARs into or out of the machine. Books on electrical machines may be consulted for a detailed account of the synchronous machine. We shall present here a simplified circuit model of the machine which with suitable modifications wherever necessary (under transient conditions).
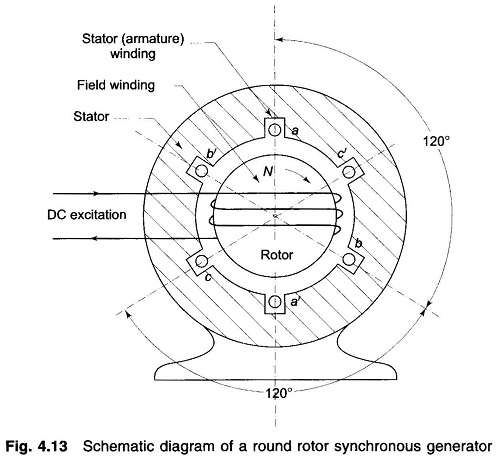
Figure 4.13 shows the schematic cross-sectional diagram of a 3 phase synchronous generator (alternator) having a two pole structure. The stator has a balanced three-phase winding aa’, bb’ and cc’. The winding shown is a concentrated one, while the winding in an actual machine is distributed across the stator periphery. The rotor shown is a cylindrical one (round rotor or non-salient pole rotor) with rotor winding excited by the DC source. The rotor winding is so arranged on rotor periphery that the field excitation produces nearly sinusoidally distributed flux/pole (Φf) in the air gap. As the rotor rotates, three-phase emfs are produced in stator winding. Since the machine is a balanced one and balanced loading will be considered, it can be modelled on per phase basis for the reference phase a.
In a machine with more than two poles, the above defined structure repeats electrically for every pair of poles. The frequency of induced emf is given by
![]()
where
- N = rotor speed (synchronous speed) in rpm
- P = number of poles
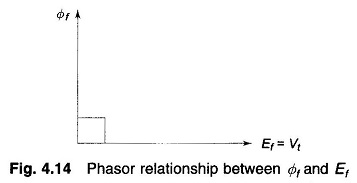
On no load the voltage Ef induced in the reference phase a lags 90° behind Φf which produces it and is proportional to Φf if the magnetic circuit is assumed to be unsaturated. This phasor relationship is indicated in Fig. 4.14. Obviously the terminal voltage Vt = Ef.
As balanced steady load is drawn from the three-phase stator winding, the stator currents produce synchronously rotating flux Φa/pole (in the direction of rotation of the rotor). This flux, called armature reaction flux, is therefore stationary with respect to field flux Φf. It intuitively follows that Φa is in phase with phase a current Ia which causes it. Since the magnetic circuit has been assumed to be unsaturated, the superposition principle is applicable so that the resultant air gap flux is given by the phasor sum
![]()
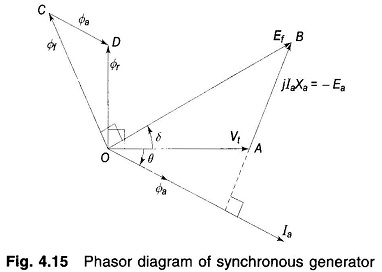
Further assuming that the armature leakage reactance and resistance are negligible, Φr induces the armature emf which equals the terminal voltage Vt. Phasor Diagram of Synchronous Motor under loaded (balanced) conditions showing fluxes, currents and voltages as phasors is drawn in Fig. 4.15.
Here
- θ = power factor angle
- δ = angle by which Ef leads Vt called load angle or torque angle
We know that δ mainly determines the power delivered by the generator and the magnitude of Ef (i.e. excitation) determines the VARs delivered by it.
Because of the assumed linearity of the magnetic circuit, voltage phasor Ef, Ea and Vt are proportional to flux phasors Φf, Φa and Φr, respectively; further, voltage phasors lag 90° behind flux phasors. It therefore easily follows from Fig. 4.15 that phasor AB = – Ea is proportional to Φa (and therefore Ia) and is 90° leading Φa (or Ia). With the direction of phasor AB indicated on the diagram
![]()
where
- Xa is the constant of proportionality.
In terms of the above definition of Xa, we can directly write the following expression for voltages without the need of invoking flux phasors.
![]()
where
- Ef = voltage induced by field flux Φf alone
- = no load emf
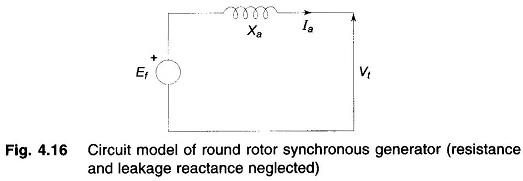
The circuit model of Eq. (4.24) is drawn in Fig. 4.16 wherein Xa is interpreted as inductive reactance which accounts for the effect of armature reaction thereby avoiding the need of resorting to addition of fluxes [Eq.(4.23)].
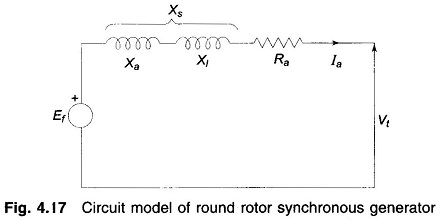
The circuit of Fig. 4.16 can be easily modified to include the effect of armature leakage reactance and resistance (these are series effects) to give the complete circuit model of the synchronous generator as in Fig. 4.17. The total reactance (Xa + Xl) = Xs is called the synchronous reactance of the machine.
Equation (4.24) now becomes
![]()
This model of the Phasor Diagram of Synchronous Motor can be further modified to account for the effect of magnetic saturation where the principle of super-position does not hold.
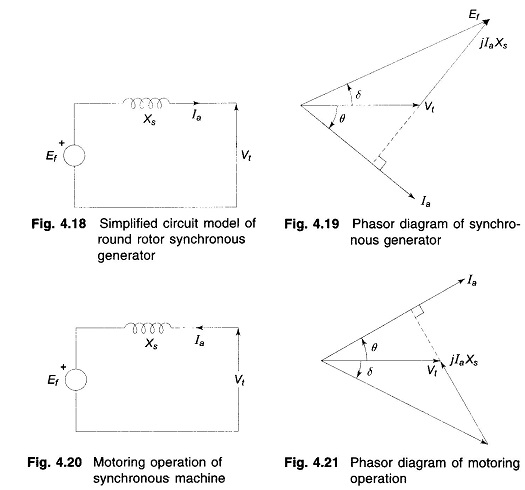
Armature resistance Ra is invariably neglected in power system studies. Therefore, in the place of the circuit model of Fig. 4.17, the simplified circuit model of Fig. 4.18 will be used throughout this book. The corresponding Phasor Diagram of Synchronous Motor is given in Fig. 4.19. The field induced emf Ef leads the terminal voltage by the torque (load) angle δ. This, in fact, is the condition for active power to flow out of the generator. The magnitude of power delivered depends upon sin δ.
In the motoring operation of a Phasor Diagram of Synchronous Motor, the current Ia reverses as shown in Fig. 4.20, so that Eq. (4.25) modifies to
![]()
which is represented by the phasor diagram of Fig. 4.21. It may be noted that Vt now leads Ef by δ. This in fact is the condition for power to flow into motor terminals.
The flow of reactive power and terminal voltage of a synchronous machine is mainly controlled by means of its excitation. Voltage and reactive power flow are often automatically regulated by voltage regulators acting on the field circuits of generators and by automatic tap changing devices on transformers.
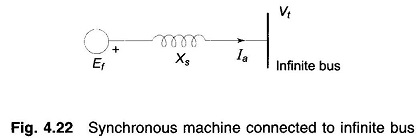
Normally, a synchronous generator operates in parallel with other generators connected to the power system. For simplicity of operation we shall consider a generator connected to an infinite bus as shown in Fig. 4.22. As infinite bus means a large system whose voltage and frequency remain constant independent of the power exchange between the synchronous machine and the bus, and independent of the excitation of the synchronous machine.
Consider now a synchronous generator feeding constant active power into an infinite bus bar. As the machine excitation is varied, armature current Ia and its angle θ, i.e. power factor, change in such a manner as to keep
![]()
It means that since |Vt| is fixed, the projection |Ia| cos θ of the phasor Ia on Vt, remains constant, while the excitation is varied. Phasor diagrams corresponding to high, medium and low excitations are presented in Fig. 4.23. The phasor diagram of Fig. 4.23(b) corresponds to the unity power factor case. It is obvious from the phasor diagram that for this excitation
![]()
This is defined as normal excitation. For the overexcited case (Fig. 4.23a), i.e. |Ef| cos δ > |Vt|, Ia lags behind Vt so that the generator feeds positive reactive power into the bus (or draws negative reactive power from the bus). For the underexcited case (Fig. 4.23c), i.e. |Ef| cos δ < |Vt|, Ia leads Vt so that the generator feeds negative reactive power into the bus (or draws positive reactive power from the bus).
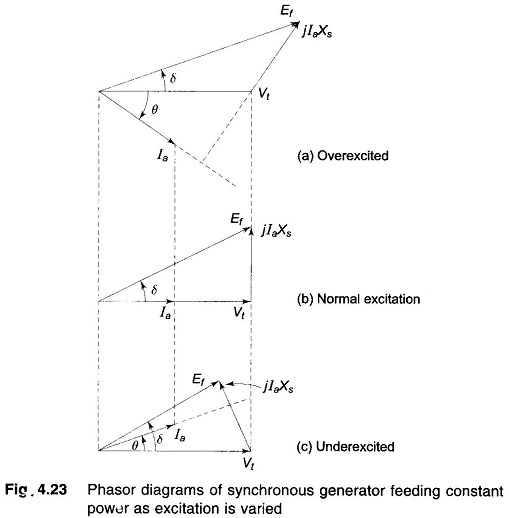
Figure 4.24 shows the overexcited and underexcited cases of synchronous motor (connected to infinite bus) with constant power drawn from the infinite bus. In the overexcited case, la leads Vt i.e. the motor draws negative reactive power (or supplies positive reactive power); while in the underexcited case Ia lags Vt, i.e. the motor draws positive reactive power (or supplies negative reactive power).
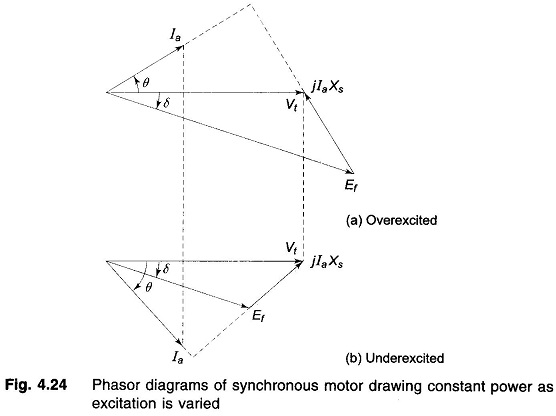
From the above discussion we can draw the general conclusion that a Phasor Diagram of Synchronous Motor (generating or motoring) while operating at constant power supplies positive reactive power into the bus bar (or draws negative reactive power from the bus bar) when overexcited. An underexcited machine on the other hand, feeds negative reactive power into the bus bar (or draws positive reactive power from the bus bar).
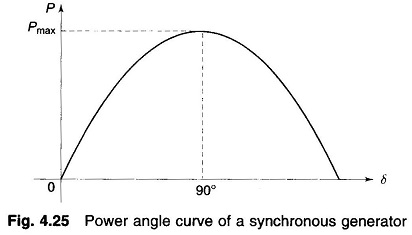
Consider now the power delivered by a synchronous generator to an infinite bus. From Fig. 4.19 this power is
![]()
The above expression can be written in a more useful form from the phasor geometry. From Fig. 4.19

or
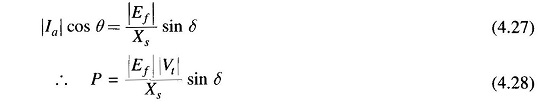
The plot of P versus δ, shown in Fig. 4.25, is called the power angle curve. The maximum power that can be delivered occurs at δ = 90° and is given by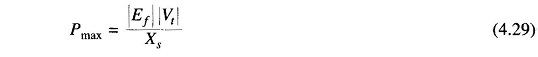
For P > Pmax or for δ > 90° the generator falls out of step.
Power Factor and Power Control:
While Figs 4.23 and 4.24 illustrate how a Synchronous Machine Phasor Diagram power factor changes with excitation for fixed power exchange, these do not give us a clue regarding the quantitative values of |Ia| and δ. This can easily be accomplished by recognizing from Eq. (4.27) that
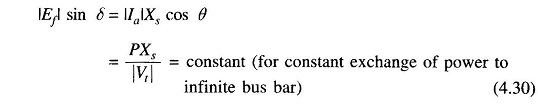
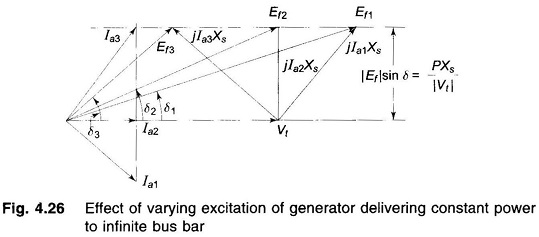
Figure 4.26 shows the phasor diagram for a generator delivering constant power to infinite bus but with varying excitation. As |Ef| sin δ remains constant, the tip of phasor Ef moves along a line parallel to Vt as excitation is varied. The direction of phasor Ia is always 90° lagging jIaXs and its magnitude is obtained from (|Ia|Xs)/Xs. Figure 4.27 shows the case of limiting excitation with δ = 90°. For excitation lower than this value the generator becomes unstable.
Similar phasor diagrams can be drawn for synchronous motor as well for constant input power (or constant load if copper and iron losses are neglected and mechanical loss is combined with load).
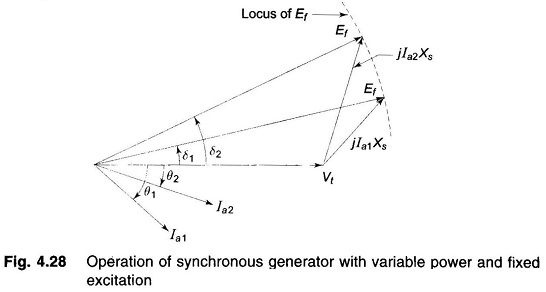
Another important operating condition is variable power and fixed excitation. In this case |Vt| and |Ef| are fixed, while δ and active power vary in accordance with Eq. (4.28). The corresponding phasor diagram for two values of δ is shown in Fig. 4.28. It is seen from this diagram that as δ increases, current magnitude increases and power factor improves. It is shown that as δ changes, there is no significant change in the flow of reactive power.