Phasor Diagram Sine Wave:
A phasor diagram can be used to represent a sine wave in terms of its magnitude and angular position. Examples of Phasor Diagram Sine Wave are shown in Fig. 5.5.
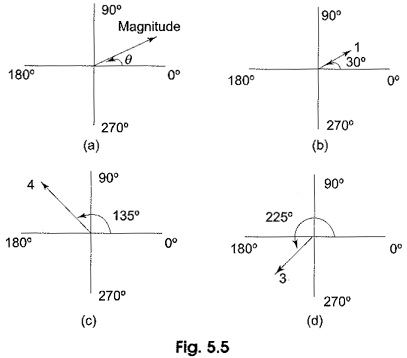
In Fig. 5.5(a), the length of the arrow represents the magnitude of the sine wave; angle θ represents the angular position of the sine wave. In Fig. 5.5(b), the magnitude of the sine wave is one and the phase angle is 30°.
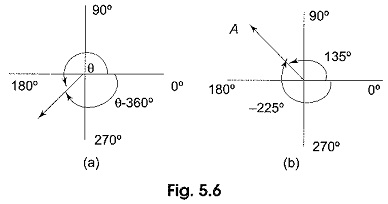
In Fig. 5.5(c) and (d), the magnitudes are four and three, and phase angles are 135° and 225°, respectively. The position of a phasor at any instant can be expressed as a positive or negative angle. Positive angles are measured counterclockwise from 0°, whereas negative angles are measured clockwise from 0°. For a given positive angle θ, the corresponding negative angle is θ — 360°. This is shown in Fig. 5.6(a). In Fig. 5.6(b), the positive angle 135° of vector A can be represented by a negative angle — 225°, (135° — 360°).
A Phasor Diagram Sine Wave can be used to represent the relation between two or more sine waves of the same frequency. For example, the sine waves shown in Fig. 5.7(a) can be represented by the phasor diagram shown in Fig. 5.7(b).
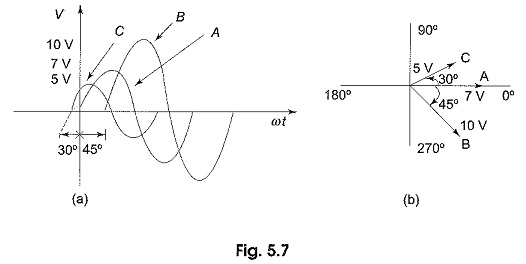
In the above figure, sine wave B lags behind sine wave A by 45°; sine wave C leads sine wave A by 30°. The length of the phasors can be used to represent peak, rms, or average values.