Statistical Process Control Interview Questions and Answers:
1. What are the sources of variations present in various processes?
Ans.
- Equipment
- Material
- Environment
- Operator
2. What is a rational subgroup? Explain.
Ans. The data that are plotted on the control chart consists of group of items called rational subgroups. A rational subgroup is one in which the variation within the group is due only to chance causes. This within-subgroup variation is used to determine the control limits. Variation between subgroups is used to evaluate long-term stability.
3. What do you mean by ‘out-of-control’ process?
Ans. The term out of control is usually thought of as being undesirable; however, there are situations where this condition is desirable. It is best to think of the term out of control as a change in the process due to an assignable cause.
4. What are the objectives of attribute charts?
Ans.
- Determine the average quality level.
- Bring to the attention of management any changes in the average.
- Improve the product quality.
- Evaluate the quality performance of operating and management personnel.
- Determine acceptance criteria of a product before shipment to the customer.
5. What is a scatter diagram?
Ans. Scatter diagram helps to determine if a cause-effect relationship exists between two variables. Data are collected as ordered pairs (x, y). Once the scatter diagram is complete, the relationship or correlation between the two variables can be evaluated.
6. Enumerate some of new management tools.
Ans.
- Forced field analysis
- Nominal group technique
- Affinity diagram
- Interrelationship digraph
- Tree diagram
- Matrix diagram
- Prioritization matrices
- Process decision program chart
- Activity network diagram
7. Explain interrelationship digraph.
Ans. The interrelationship digraph clarifies the interrelationship of many factors of a complex situation. It allows the team to classify the cause – and – effect relationships among all the factors so that the key drivers and outcomes can be used to solve the problem.
8. What is the use of process decision program chart?
Ans. Program to achieve particular objectives do not always go according to plan, and unexpected developments may have serious consequences. The process decision program chart avoids surprises and identifies possible counter measures. The procedure starts with the team stating the objective, which is to plan a successful conference.
9. Explain about matrix diagram.
Ans. The matrix diagram allows individuals or teams to identify, analyze, and rate the relationship among two or more variables. Data re presented in table form and can be objective or subjective, which can be given symbols with or without numerical values.
10. What is tree diagram and what’s the use?
Ans. Tree diagram is used to reduce any broad objective into increasing levels of detail in order to achieve the objective. The first step is to choose an action-oriented objective statement from the interrelationship diagram, affinity diagram, brainstorming, team mission statement, and so forth. Second, using brainstorming, choose the major headings. Third, generate the next level by analyzing the major headings. The tree diagram encourages team members to think creatively, makes large projects manageable, and generates a problem-solving atmosphere.
11. What does the prioritization matrices do?
Ans. These tools prioritize issues, tasks, characteristics, and so forth, based on weighted criteria using a combination of tree and matrix diagram techniques. Once prioritized, effective decisions can be made. Prioritization matrices are designed to reduce the team’s options rationally before detailed implementation planning occurs.
12. Briefly describe the process of six sigma.
Ans. According to james harrington, “six sigma was simply a tqm process that uses process capability analysis as a way of measuring progress. Sigma is the greek symbol for the statistical measurement of dispersion called standard deviation. It is the best measurement of process variability, because the smaller the deviation value, the less variability in the process.
13. What are the seven basic tools for statistical process control?
Ans. There are seven basic tools or techniques :
- Pareto diagram analysis
- Process flow chart ( diagram )
- Cause-and-effect diagram ( fish bone diagram )
- Check sheets
- Histogram
- Scatter diagrams
- Statistical process control charts.
14. How do you construct a cause effect diagram?
Ans.
- Project team is formed to identify the ‘effect’ or quality problem. It is placed on the right side of a large piece of paper by the team leader
- Major causes are identified and placed on the diagram.
- Minor causes are determined after brainstorming of the project team.
15. What are the points to be observed for effective brain storming?
Ans.
- Participation by every member of the team is facilitated by each member taking a turn giving one idea at a time.
- Quantity of ideas, rather than quality, is encouraged.
- Criticism of an idea is not allowed.
- Visibility of the cause-and-effect diagram is a primary factor of participation.
- Create a solution —oriented atmosphere. The team leader should ask questions using the why, what, where, when, who and how technique.
- Let the ideas incubate for a period of time and then have another brainstorming session.
- When no more ideas are generated, the brainstorming activity is terminated.
16. Give an example of a histogram.
Ans.
Example: ungrouped data
- Data collected as it is and tabulated
- Establish an array in the order of ascending or descending magnitude and tabulate and make a histogram for the table.
17. Write about run chart.
Ans.
- Run charts are the most widely used ones in tqm.
- It is a very simple technique for analyzing the process. Plotting the data points is very effective way of finding out about the process.
18. How do you calculate revised control line and control limits?
Ans. Revised central lines and control limits are established by discarding out-of-control points with assignable causes and recalculating the central lines and control limits.
19. When a process is considered out of control even when the points fall inside limits?
Ans. A process can also be considered out of control even when the points fall inside the limits, when unnatural runs of variation are present in the process.
20. Define capability index.
Ans. Capability index CP is defined as
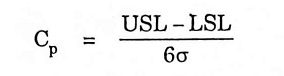
where
- USL – LSL = upper specification limit – lower specification limit
- 6σ = process capability
21. What is non-conformity and how does it differ from defect?
Ans.
- Non conformity is a departure of a quality characteristic from its intended level or state that occurs with a severity sufficient to cause an associated product or service not to meet a specification requirement.
- Defect is appropriate for use when evaluation is in terms of usage, and non-conformity is appropriate for conformance to specifications.
22. When a product is called a non-conforming unit?
Ans. Non conforming unit is a unit of product or service containing at least one non conformity.
23. Define p, np, u and c charts.
Ans.
- P’ chart: a proportion, p, chart shows the proportion nonconforming in a sample or subgroup. The proportion is expressed as a fraction or a percent.
- ‘np’ chart: is for number nonconforming, np.
- ‘c’ chart: a ‘c’ chart shows the count of nonconformities in an inspected unit.
- ‘u’ chart: is for the count of nonconformities per unit.
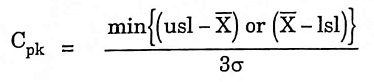
24. Define Cpk
Ans. Cpk is defined as: