Random Noise Generator Block Diagram and its Working:
A simplified Random Noise Generator Block Diagram used in the audio frequency range is shown in Fig. 8.8.
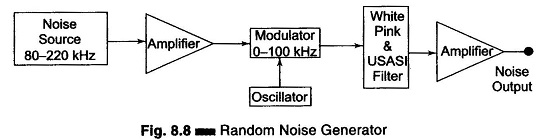
The instrument offers the possibility of using a single measurement to indicate performance over a wide frequency band, instead of many measurements at one frequency at a time. The spectrum of random noise covers all frequencies and is referred to as White noise, i.e. noise having equal power density at all frequencies (an analogy is white light). The power density spectrum tells us how the energy of a signal is distributed in frequency, but it does not specify the signal uniquely, nor does it tell us very much about how the amplitude of the signal varies with time. The spectrum does not specify the signal uniquely because it contains no phase information.
The method of generating noise is usually to use a semi conductor noise diode, which delivers frequencies in a band roughly extending from 80 – 220 kHz. The output from the noise diode is amplified and heterodyned down to the audio frequency band by means of a balanced symmetrical modulator. The filter arrangement controls the bandwidth and supplies an output signal in three spectrum choices, white noise, pink noise and Usasi noise in the random noise generator.
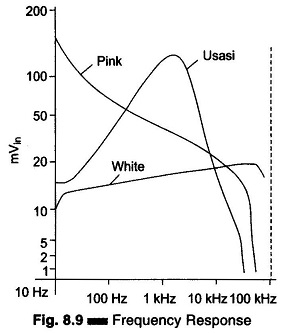
From Fig. 8.9, it is seen that white noise is flat from 20 Hz to 25 kHz and has an upper cutoff frequency of 50 kHz with a cutoff slope of -12 dbs/ octave.
Pink noise is so called because the lower frequencies have a larger amplitude, similar to red light. Pink noise has a voltage spectrum which is inversely proportional to the square root of frequency and is used in bandwidth analysis.
Usasi noise ranging simulates the energy distribution of speech and music frequencies and is used for testing audio amplifiers and loud speakers.