Single Line Diagram of Power System and Impedance or Reactance Diagram:
A single line diagram of power system shows the main connections and arrangements of components. Any particular component may or may not be shown depending on the information required in a system study, e.g. circuit breakers need not be shown in a load flow study but are a must for a protection study. Single line diagram of power system using suitable symbols for generators, motors, transformers and loads.
It is a convenient practical way of network representation rather than drawing the actual three-phase diagram which may indeed be quite cumbersome and confusing for a practical size power network. Generator and transformer connections—star, delta, and neutral grounding are indicated by symbols drawn by the side of the representation of these elements. Circuit breakers are represented as rectangular blocks. Figure 4.5 shows the single line diagram of simple power system. The reactance data of the elements are given below the diagram.
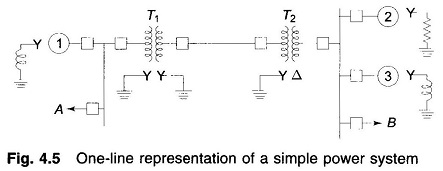
- Generator No. 1 : 30 MVA, 10.5 kV, X” = 1.6 ohms
- Generator No. 2 : 15 MVA, 6.6 kV, X” = 1.2 ohms
- Generator No. 3 : 25 MVA, 6.6 kV, X” = 0.56 ohms
- Transformer T1 (3 phase) : 15 MVA, 33/11 kV, X = 15.2 ohms per phase on high tension side
- Transformer T2 (3 phase): 15 MVA, 33/6.2 kV, X = 16 ohms per phase on high tension side
- Transmission line: 20.5 ohms/phase
- Load A : 15 MW, 11 kV, 0.9 lagging power factor
- Load B : 40 MW, 6.6 kV, 0.85 lagging power factor
Note: Generators are specified in three-phase MVA, line-to-line voltage and per phase reactance (equivalent star). Transformers are specified in three-phase MVA, line-to-line transformation ratio, and per phase (equivalent star) impedance on one side. Loads are specified in three-phase MW, line-to-line voltage and power factor.
The impedance diagram on single-phase basis for use under balanced operating conditions can be easily drawn from the one-line diagram. For the system of Fig. 4.5 the impedance diagram is drawn in Fig. 4.6. Single-phase transformer equivalents are shown as ideal transformers with transformer impedances indicated on the appropriate side. Magnetizing reactances of the transformers have been neglected. This is a fairly good approximation for most power system studies.
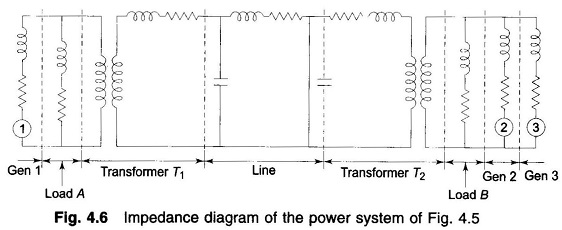
The generators are represented as voltage sources with series resistance and inductive reactance. The transmission line is represented by a π-model. Loads are assumed to be passive (not involving rotating machines) and are represented by resistance and inductive reactance in series. Neutral grounding impedances do not appear in the diagram as balanced conditions are assumed.
Three voltage levels (6.6, 11 and 33 kV) are present in this system. The analysis would proceed by transforming all voltages and impedances to any selected voltage level, say that of the transmission line (33 kV). The voltages of generators are transformed in the ratio of transformation and all impedances by the square of ratio of transformation. This is a very cumbersome procedure for a large network with several voltage levels. The per unit method discussed below is the most convenient for power system analysis. The most convenient method for power system is the Per Unit System method.