Single Stage Amplifier Frequency Response and Phase Response Curves:
The voltage gain of a single-stage transistor amplifier commences to fall off at some high frequency. This fall-off may be due to the construction of the individual transistor or to stray capacitance in the circuit. Gain-frequency response of single stage amplifier is depicted in Fig. 35.1, the frequency being plotted on a logarithmic base. The voltage gain falls off at a rate of 6 dB per octave i.e. there is a fall off of 6 dB for each doubling frequency, and it can also be stated as 20 dB for each tenfold increase in frequency (-20 dB per decade). The pole frequency fp is the frequency at which the gain is down by 3 dB from its midband value.
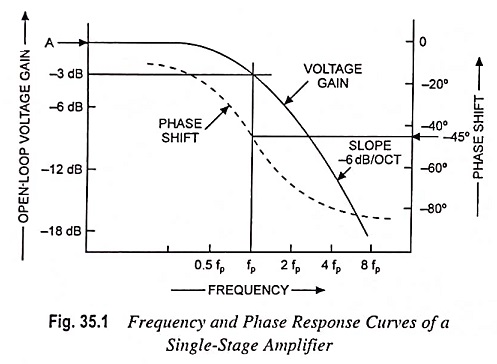
Figure 35.1 also depicts a graph of phase shift versus frequency for a single-stage transistor circuit. The phase shift increases from zero until it is -45° at the pole frequency fp and continues to increase with increase in frequency to a maximum of -90°, as shown in Fig. 35.1.
Op-amps generally consist of three stages, namely, a differential input stage, an intermediate amplification stage, and low impedance output stage. Each of these stages has its own gain-frequency and phase-frequency response. Usually the pole frequency of second stage is higher than that of stage 1, and the pole frequency of third stage is higher still.
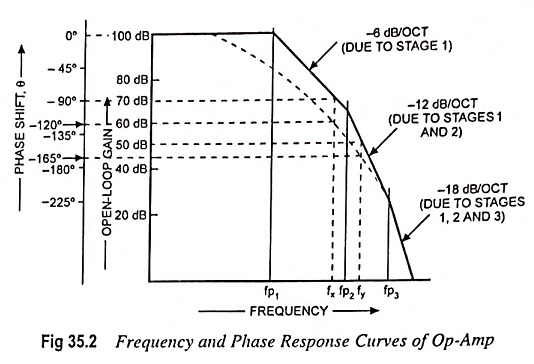
A straight-line approximation of gain-frequency response curve for a typical op-amp is given in Fig. 35.2. From the curve shown in Fig. 35.2 it is noted that the overall voltage gain initially falls off at -6 dB per octave or -20 dB/decade from fp1, when only the gain of first stage is decreasing. At pole frequency fp2, second stage gain is now falling off at -6 dB per octave, thus the total rate of fall off is -12 dB/octave or -40 dB per decade. Finally, when the operating frequency becomes equal to fp3 the gain of third stage commences to fall off, and the overall rate of decline of voltage gain is -18 dB/octave or -60 dB/decade.
The phase-shifts of individual stage also add together, as illustrated on the total phase-shift versus frequency curve in Fig. 35.2. At pole frequency fp1, only first stage is effective, and the total open-loop phase shift is -45°. At pole frequency fp2 second stage adds another -45°, but at this point first stage phase shift is at its maximum of -90°. Thus the total phase shift is (-45° – 90°) = -135°. When the frequency becomes fp3, first stage and second stage are each contributing -90° of phase shift, and the third stage adds a further -45°. Consequently, the total phase shift at pole frequency fp3 is -225°(-90° – 90° – 45°). This open-loop phase shift is in addition to the -180° phase shift that normally occurs from the op-amp inverting input terminal to the output.
As already discussed, oscillations occur when loop gain Aβ ≥ 1 and loop phase shift Φ is -360°. In fact it is not necessary that phase shift may be -360° for oscillation to occur. A phase shift of -330° at Aβ ≥ 1 makes the circuit unstable. The total loop phase shift must not exceed -315° when Aβ = 1, so as to avoid oscillations. The difference between the actual phase shift Φ at Aβ = 1 and 360° is known as phase margin. For stability, the phase margin should not be less than 45°.
As the Single Stage Amplifier Frequency Response is shown in Fig. 35.2, the maximum gain is 100 dB, which is equivalent to a voltage gain of 105.