Digital Measurement of Frequency (Mains):
Digital Measurement of Frequency (Mains) – The conventional method of measuring the frequency of an electrical signal consists of counting the number of cycles of the input electrical signal during a specified gate interval. The length of the gate interval decides the resolution of the Measurement. The shorter the gate interval, the lesser is the resolution. Now, for frequencies of the order of kHz and above, it is possible to get a resolution of 0.1% of better with a nominal gate time of 1 (sec). But for low frequencies, in order to obtain a resolution of even 0.5%, the gate time has to be considerably larger. For example, consider the case when the input electrical signal frequency is around 50 Hz. In order to obtain a resolution of 0.1 Hz, the gate interval has to be 10 seconds and in order to obtain a resolution of 0.01 Hz, the gate interval has to be 100 s. These gate periods of 10 s and 100 s are too long and in many cases it is desirable to obtain an indication of the frequency in far less time. Hence, direct or ordinary frequency counters are at a great disadvantage when it comes to low frequency measurements.
For the mains frequency monitor, the frequency range of interest is rather narrow, (50 ± 5%) Hz. The technique employed in the Measurement of mains frequency, yields only a parabolic calibration curve. But within the narrow frequency range, which in this case is (50 ± 5%) Hz, the calibration is conveniently flat. Hence, the error due to the non-linear calibration is less than 0.2% at a frequency deviation as large as 5% from the centre frequency, which is 50 Hz. The error is 0.02% at a frequency deviation as large as 2% from the centre frequency and as the frequency approaches the centre value of 50 Hz, the error approaches zero.
The principle that backs up this technique is as follows.
Consider the relationship between the frequency and time period of the input electrical signal, f = 1/T. For an ac power line, the desired frequency is 50 Hz; let us denote it as F50. If we denote the corresponding period by T50, then T50 = 1/50 s = 20 ms. Now, let us further denote any frequency x as Fx and the corresponding period as Tx. Now, we introduce a new time scale for measuring the period of the electrical input signal whose frequency Measurement is desired. Let us formulate the relationship between the MKS scale and the new scale as 20 ms = 50 ku (ku = kilounit), where ku is the unit of the new time scale. Therefore, 1 s = 50 1/20 x 1000 = 2500 ku.
Let us determine the periods corresponding to various frequencies from 45 Hz to Hz in terms of ku.
T45 = 1/45 s = 2500/45 ku = 55.55 ku
T46 = 1/46 s = 2500/46 ku = 54.35 ku
T47 = 1/47 s = 2500/47 ku = 53.19 ku
T48 = 1/48 s = 2500/48 ku = 52.08 ku
T49 = 1/49 s = 2500/49 ku = 51.02 ku
T50 = 1/50 s = 2500/50 ku = 50.00 ku
T51 = 1/51 s = 2500/51 ku = 49.02 ku
T52 = 1/52 s = 2500/52 ku = 48.08 ku
T53 = 1/53 s = 2500/53 ku = 47.16 ku
T54 = 1/54 s = 2500/54 ku = 46.29 ku
T55 = 1/55 s = 2500/55 ku = 44.44 ku
Now within this narrow frequency range of 45 – 55 Hz, we can form an empirical relation between the frequency and period of signals, as Fx = 100 – Tx, where Fx is the frequency in Hz and Tx is the period in ku.
In order to determine the frequency of the input electrical signal, the period of the input signal has to be measured in terms of ku and then subtracted from 100. If an indication of the frequency Fx correct to 1 Hz (resolution is 1 Hz), is sufficient, then it is enough if the period Tx of the input signal is measured correct to 1 ku. In order to obtain 4 digit indication, the period Tx of the input signal has to be measured correct to 0.01 ku. To determine the period of the input electrical (power line) signal in terms of 0.01 ku, we need a reference signal whose period is 0.01 ku. This signal is obtained from a stable crystal controlled reference oscillator. The number of cycles of this reference signal during 1 cycle of the input signal gives the period Tx in terms of 0.07 ku. Rather than employing separate circuitry to determine the period and then subtracting it from 100, an UP/DOWN counter is used in the down counted mode. Thus the processes of counting the period and doing the subtraction are done simultaneously by the same circuitry.
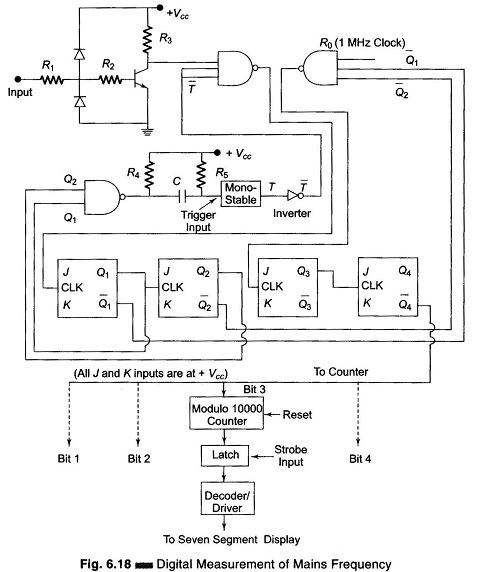
The schematic diagram shown in Fig. 6.18, is the circuitry of the Digital Measurement of Frequency (Mains), consisting of the input wave shaper, reference clock generator, sequence control logic unit, counter display and intermediate latch circuitry.
Let us analyze the Digital Measurement of Frequency (Mains) circuit, assuming the input signal is exactly 50 Hz. When the reference clock frequency is 1 MHz, there will be 20,000 pulses in the 20 ms period. These 20,000 pulses are divided by the other two flip-flops by a factor of 4, to get 5000 pulses in the measuring period of 20 ms. Now these pulses are counted down in the 10000 modulo counter and are displayed.
Let us consider the case, when the input signal frequency is 48 Hz. The period i.e. 1/48 s = 20.83 ms. Within this period, the number of pulses will be 5208. (For 20 ms the count is 5000, hence for 20.83 ms the count is
![]()
Therefore, 20.83 ms the count is 5208). Now, these pulses are counted down and the display reading is 10000 – 5208 = 4792; 48 Hz is displayed as 47.92 Hz.