Measurement of Physical Quantities:
Measurement of Physical Quantities is given by
- Displacement Measurement
- Strain Measurement
- Force Measurement
- Torque Measurement
- Pressure Measurement
- Temperature Measurement
- Water-Level Indicator
- Measurement and Display of Speed of a Motor
Nowadays, physical quantities such as force, displacement, acceleration, velocity, speed, temperature, pressure, flow and level, etc., are measured and displayed using microprocessors and interfacing devices in industry. For the measurement of any physical quantity, transducers are used to convert energy from motion, displacement, acceleration, velocity, flow, pressure, level, heat, light, sound and any other Measurement of Physical Quantities into electrical energy. A transducer consists of sensor and signal conditioning circuit. Most commonly used transducers are potentiometers, capacitive and inductive transducers, level transducers, strain gauge, accelerometer, Linear Variable Differential Transformer (LVDT), piezoelectric crystals and diaphragm, etc. Electrical output of a transducer is very small and it is not in measurable condition; therefore it should be amplified by using amplifiers. Figure 10.29 shows the schematic block diagram of a Measurement of Physical Quantities.
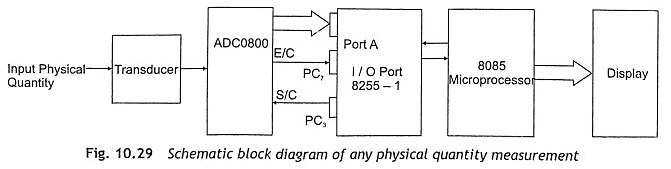
The output electrical signal from transducer is fed to an A/D converter, which converts analog signal to digital form and then applies to the 8085 microprocessor through 8255 PPI. The 8085 microprocessor reads this digital data and displays it in seven-segment display. When it is required to measure and display more than one Measurement of Physical Quantities, a multiplexer should be incorporated in between transducers and the A/D converter. In section. the working principle of measuring displacement, strain, pressure, force, torque, speed and temperature are discussed in detail.
Displacement Measurement
In a displacement-measurement potentiometer, capacitive transducers and Linear Variable Differential Transformers (LVDT) are generally used. In a potentiometer, the object moves the tap on a variable resistance and output voltage is directly proportional to displacement. Pots are used as potentiometers, shown in Fig. 10.30.
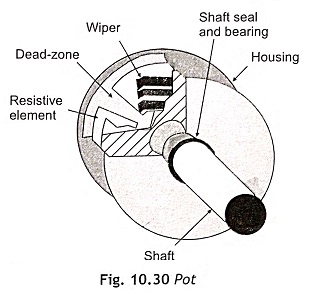
In a pot, an electrically conductive wiper slides against a fixed resistor element. To measure displacement, the potentiometer is typically wired in a voltage divider configuration as depicted in Fig. 10.31. The output voltage is a function of the wiper’s position and it is an analog voltage.
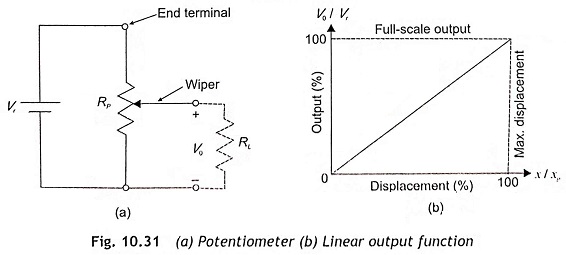
The output voltage V0 can be expressed as
![]()
where
- Vr = the reference voltage,
- V0 = output voltage,
- xp = the maximum wiper position, and
- x = displacement.
This type of resistive displacement sensor has some advantages such as ease of use, low cost, high-amplitude voltage signal and passivity. But its disadvantages are limited bandwidth, frictional loading, inertial loading and wear. The potentiometer is commonly used in positioning of robotics like artificial limbs and servo systems.
In capacitive displacement transducer, one plate of the capacitor is mounted to a fixed surface and the other plate mounted to the object. With the position of object, capacitance value changes. The capacitive displacement sensor generates an output signal due to change in capacitance. The capacitance is a function of distance (d) between the electrodes, the surface area (A) of the electrodes, and the permittivity ε as given below:
![]()
where
- ε0 is permittivity of air, and
- εr is the relative permittivity.
The change in capacitance due to change in distance is
![]()
Capacitor sensors are variable-distance displacement sensors, variable-area displacement sensors, and variable-dielectric displacement sensors as depicted in Fig. 10.32 (a), (b) and (c) respectively.
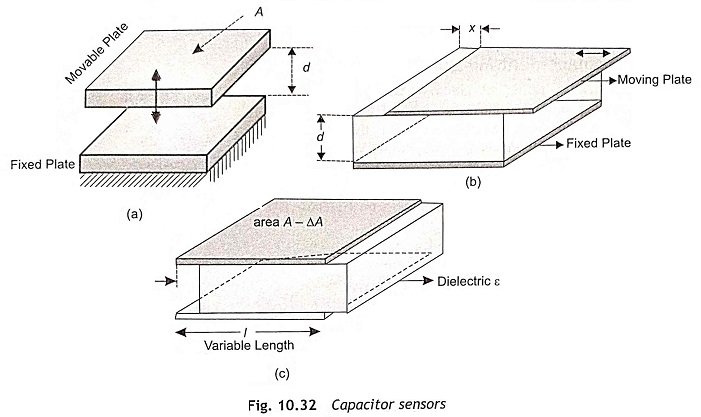
Capacitor value in variable-area displacement sensors is
![]()
where
- w width,
- wx then reduction in the area due to movement of the plate.
In variable dielectric displacement capacitive sensors,
![]()
where
- ε2 is the permittivity of the displacing material, and
- ε1 is the relative permittivity of the dielectric material.
Generally, a capacitive transducer can be placed in a bridge circuit and ac voltage is connected across the bridge. Then the bridge output voltage is amplified, rectified and measured.
A Linear Variable Differential Transformer (LVDT) is a three-coil inductive transducer and object moves core of three winding. A three winding transformer (one primary and two secondary) with a movable core is shown in Fig. 10.33. It is a passive inductive transducer. The two secondary’s are having equal sizes, shapes and number of turns. Primary winding of transformer is supplied by 1-10 V, 50 Hz – 25 kHz ac signal. Each secondary winding covers one half of transformer, secondary’s connected to oppose each other and the object is connected to the core.
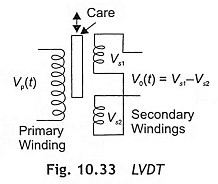
The mutual inductance between the primary and secondary windings is changed with the change in position of a high permeability rod. The induced voltages at secondary’s are Vs1(t) = K1Vp(t), Vs2(t) = K2Vp (t). As secondary windings are connected in series opposition, the output voltage V0(t) = Vs1(t) – Vs2(t). As the rod moves from the Centre, K1 increases while K2 decreases.
When the core is centered, voltages at two secondary’s are equal and the output voltage is zero. While core is off center, voltage at one secondary is higher than other one. Thus output voltage is linearly related to core position as depicted in Fig. 10.34.
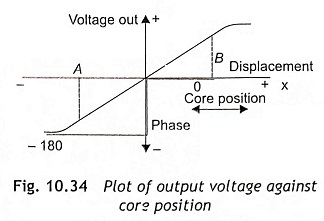
The model function of LVDT is V0(x, t) = KVp(t) where K is a constant, t is time, Vp(t) is the primary voltage, x is displacement and it will be either positive or negative. If x is negative, phase of output voltage is reversed.
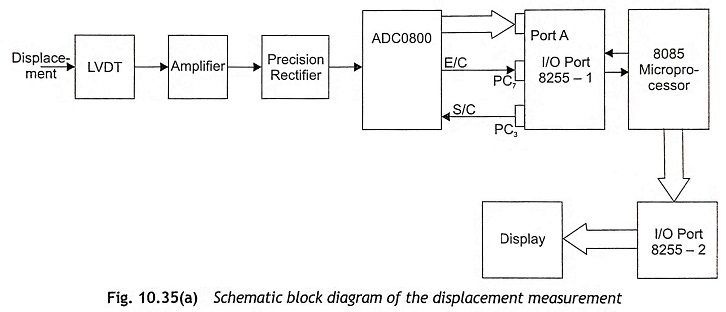
The schematic block diagram of the displacement or deflection measurement is shown in Fig. 10.35. LVDT is used to sense the deflection of a beam as the movable core of the linear variable differential transformer is connected to the beam. When the core is in centered position, the voltages induced in two secondary’s of the LVDT are equal. Hence output voltage will be zero. While the core is moved in upward or downward directions, the voltage induced in two secondary’s will not be equal and output voltage is equal to the difference between secondary induced voltages as expressed by V0 = Vs1-Vs2. This output voltage V0 is directly proportional to the displacement of core. The output voltage of LVDT is low and in the range of 100-500 mV. Therefore, an amplifier should be used to amplify LVDT output and fed to a precision rectifier for rectification. Then precision rectifier output voltage is applied to A/D converter for analog to digital conversion. The digital output of the A/D converter is fed to Port A of 8255-1 as depicted in Fig. 10.35 (a).
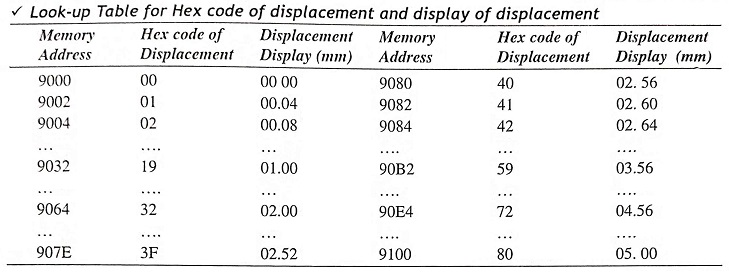
A look-up table between the digital output of the A/D converter and displacement/deflection is stored in the memory of the microprocessor. By using a look-up table, the microprocessor measures deflection for a particular A/D converter digital output and displays the same on seven-segment display though 8255-2 PPI IC. The desirable characteristics are low wear, less repeatability error, high speed and ability to measure small displacements of approximately 0.04 mm. This method can also be used for vibration measurement. The undesirable characteristics are complex conditioning circuit and expense.
Strain Measurement
Strain is the change in shape of an object due to some force. Assume an object in two conditions: with and without a force applied. When an external force is applied along a dimension, there will be some deformation in the object.
Let L1 be the length of the object along the dimension when no force is applied and L2 be the length when the force is applied. Then the object’s strain is
![]()
where
- ΔL = L2-L1 change in length.
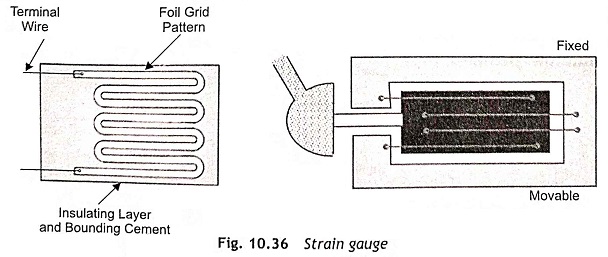
A stain transducer is used for strain measurement. Strain gauge is a stain transducer and is used to measure strains and stresses in any structures. A strain gauge is a flexible card with strip of some copper–nickel alloy conductor wires arranged in special pattern as shown in Fig. 10.36. The grids of fine wires forming a strain gauge are cemented to a thin paper membrane. The strain gauge is mounted on the object being measured. A strain-gauge conductor is usually made of metal or semiconductor. The pattern is chosen in such a way that the conductor maintains an almost constant volume with strain. That is, the conductor is not compressible.
The resistance of a conductor is
![]()
where
- L is its length,
- A is its area, and
- ρ is its resistivity.
Assume force causes length of the conductor to decrease. Since volume does not change much, area must increase. Thus, resistance decreases. The model function of resistance is equal to R1 = R0 ( 1 + Gfε) where Gf is a constant and known as the gauge factor which is the ratio ΔR/R /ΔL/L and may he considered as the sensitivity of the sensor. R0 is resistance without strain, R1 is resistance due to strain, and ε is strain.
For metal-wire strain gauges (constantan), Gf = 2 while semiconductor strain gauges have much higher Gf of about 200. Bonded strain gauges have folded wires bonded to a semiflexible backing material, with unbonded gauges having flexible wires connected between fixed and movable frames as shown in Fig. 10.36.
The sensitivity of a strain gauge is very low which is approximately 1% over full operating range. But it is very important that the above change must be accurately detected.
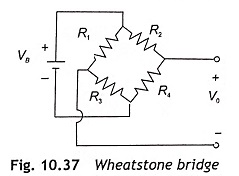
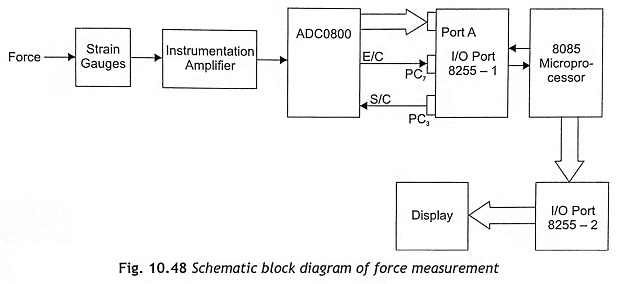
To increase the sensitivity, two and more active sensor elements can be used in a bridge circuit. In strain measurement, a Wheatstone bridge is used a device. which can read a difference voltage directly. The output voltage of the Wheatstone bridge as shown in Fig. 10.37 is expressed as
![]()
The sensor bridge usually consists of four identical sensor elements. Assume that only one of these is sensitive to the strain, which can be measured, and other sensors are ‘dummy’ sensors. For example, for a maximum of 1% change in resistance, the output voltage is about 0.0025VB. This is approximately 2.5 mV for a 10 V supply. Therefore, the range of V0 in this case is 0-2.5 mV.
![]()
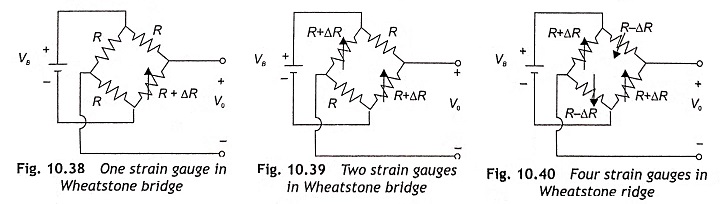
Increased measurement accuracy and possibility for increased sensitivity are shown in Fig. 10.39 and Fig. 10.40 respectively. Elimination of ‘noise’ effects on a sensor output; i.e. if a sensor is sensitive to changes in both temperature and strain, if 4 identical elements are used:
![]()
with only one of them subjected to the strain, the temperature effect is cancelled. The output voltage can be expressed
- for two Strain gauges in Wheatstone bridge, and
- for four Strain gauges in Wheatstone
![]()
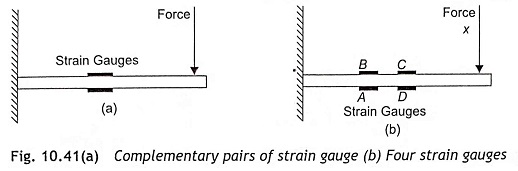
In some cases, the strain in two places on the object will be of equal magnitude but of opposite sign. For example, a cantilever beam is as shown in Fig. 10.41. The upper part of the beam is stretched (positive strain) and the lower part of the beam is compressed (negative strain). The two strain gauges, therefore, form complementary pairs.
Physically, a strain gauge is not much different from an RTD and so, a strain gauge is affected by temperature. Hence, temperature compensation is required. The model function including temperature.
R1 = R0(T )(1 + Gfε), where R0(T) is a function of temperature. Conditioning circuit can remove R0(T). A bridge circuit does this very well.
For a complimentary pair, R1 = R0(T)(1 ± Gfε)
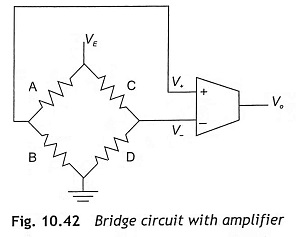
Four strain gauges are placed in the bridge form as shown in Fig. 10.42. The temperature terms will be canceled and the output voltage V0 = AVE Gfε, where A = gain of amplifier, VE = input voltage, Gf = gauge factor, and ε = strain.
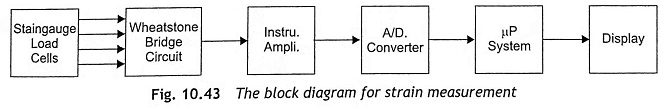
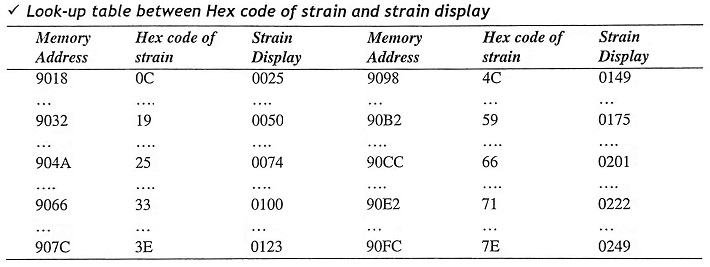
Figure 10.43 shows the block diagram for strain measurement when two gauges are mounted to a cantilever beam. Due to change in resistance, bridge output voltage changes and its magnitude is directly proportional to strain. Then output of the bridge is fed to a instrumentation amplifier and amplified to a certain voltage in the range of 0-5 V so that it can be processed by the microprocessor. Output is 0 V for no strain and 5 V for the maximum strain. When four strain gauges are mounted in a cantilever beam, the output voltage increases two times. A look-up table between the hex code of digital voltage and strain is stored in memory. After converting the analog voltage into digital form through an A/D converter, find the strain from the look-up table and display it in seven-segment display unit. The program for displacement measurement may also be used in strain measurement with the modification in look-up table only.
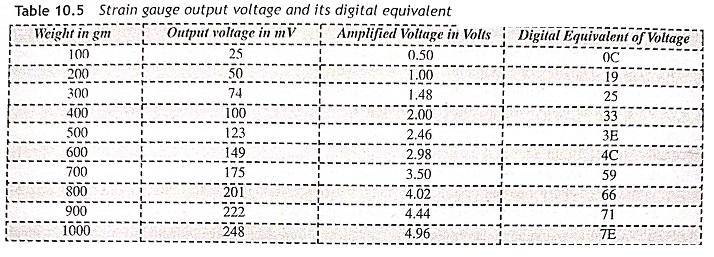
Assume the dimension of cantilever beam Length L = 22 cm, Breadth B = 2.8 cm and thickness T = 0.3 cm and Young’s modulus Y of stainless steel = 2.1 x 10⁶.
The strain is calculated by the following expression:
![]()
where = the weight applied at the end of the cantilever beam
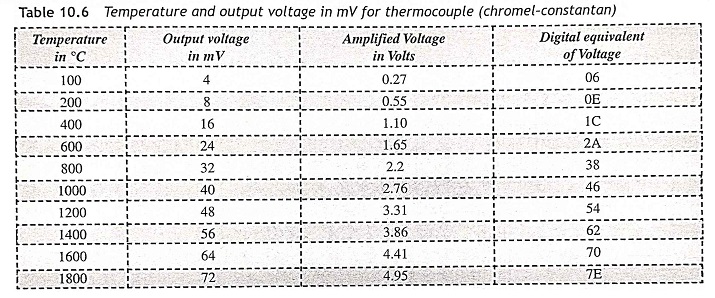
If W = 1kg, the strain is about 248. When load variation is 100 g to 1 kg, the output voltage of strain gauge in mV is given in Table 10.5.
Force Measurement
There are many types of sensors which can be used to measure force. Resistance-type force sensors, such as gauges and load cells, are very commonly used in force measurement. The force can be measured by the following ways:
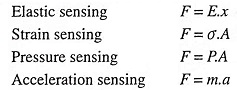
Force can move a part of the transducer. This movement can be measured using displacement sensors.
Piezoelectric crystals are also used in force measurement A piezoelectric crystal consists of a crystal of a material with piezoelectric properties, i.e., a piezoelectric material emits charge when compressed. The material may be quartz, or special ceramics. Contacts are always placed along two faces of the crystal.
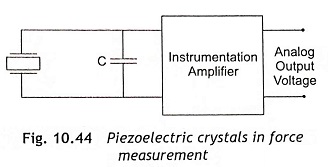
When force or pressure is applied to the crystal, a charge appears on the surface of the crystal and the amount of charge directly proportional to the force. Therefore, the output of the transducer is charge. The output of the crystal is converted to voltage using a capacitor. The voltage generated from piezoelectric crystals is V, which can be expressed as
![]()
The capacitor should be chosen in such a way, so as to get the desired voltage range. The capacitor voltage is fed to very high input impedance amplifier for amplification, and amplifier output is applied to A/D converter for analog-to-digital conversion.
When an unchanging force is applied, the voltage will decrease over time. Therefore, piezoelectric crystals are best used for measuring changes in force and vibration.
A load cell is most commonly used to measure mechanical force. Strain gauges are called load cells and normally used for force measurement. The force bends, compresses, or stretches a part of the transducer and change in shape is usually measured using strain gauges. Two common load-cell configurations are illustrated in Fig. 10.45. Usually. load cells are sold including a bridge circuit.
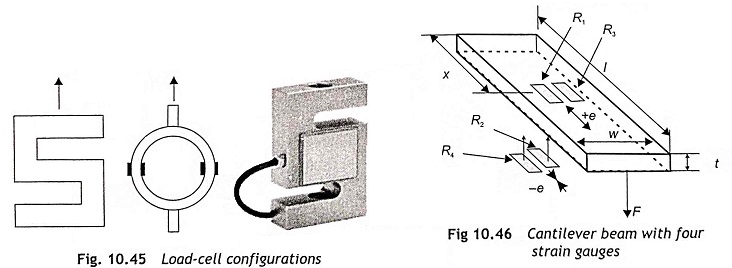
Resistance of a strain gauge increases if it is stretched. Strain gauges are cemented over the mechanical structure whose deformation under the influence of stress is to be measured. Figure 10.46 shows a cantilever beam with four strain gauges. The force is applied at a predetermined point. Strain gauges are placed at locations chosen so that their output is linearly related to force. The choice of location for the strain gauges and the derivation of the resulting load-cell model function are beyond the scope of this book. Load cells are usually packaged with strain gauges connected in bridge configuration. Strain gauges 1 and 2 are mounted so that after applying load, they come under tension. Similarly, strain gauges 3 and 4 will be under compression under loaded condition. Strain gauges are normally used in a full bridge to give the bridge output proportional to the applied force. To maximize the bridge sensitivity, the strain gauge is connected in a bridge. Under loaded conditions, resistance of strain gauges 1 and 2 increases and 3 and 4 decreases. Therefore, the potential at Point A of the bridge will be elevated much as compared to. As all four gauges are at the same temperature, this system also provides temperature compensation. Strain gauges are bonded in such a way that can provide the maximum output deformation ratio. The strain gauges are wired in full-bridge configuration for temperature compensation and for better accuracy of measurement. The complete assembly must be housed within a protective case and properly sealed so that the external environment cannot affect strain gauges though strain gauges are capable to deform after application of the force.
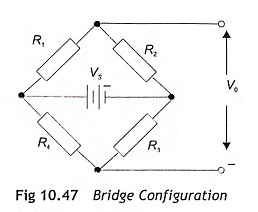
When strain gauges are used in cantilever type load cells, the strain can he expressed as
![]()
where F = force, l = length, w = width, t = thickness, and E Young’s modulus.
The output voltage of the bridge will be
![]()
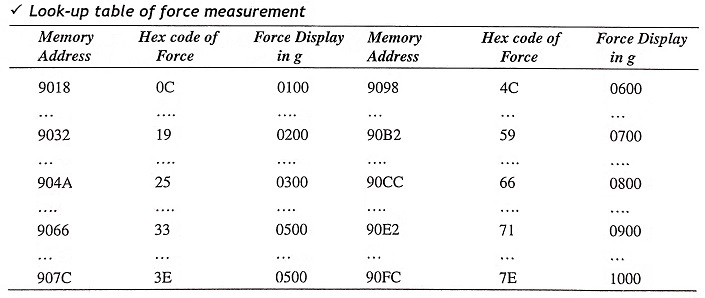
The block diagram for force measurement is shown in Fig. 10.48. The program for displacement measurement can he used in force measurement, but there will be sonic modification in the look-up table. A look-up table between the hex code of digital voltage corresponding to force is stored in memory. The 8085 microprocessor reads the digital output of A/D converter for a force input and determines the force from the look-up table and display it in seven-segment display unit.
Torque Measurement
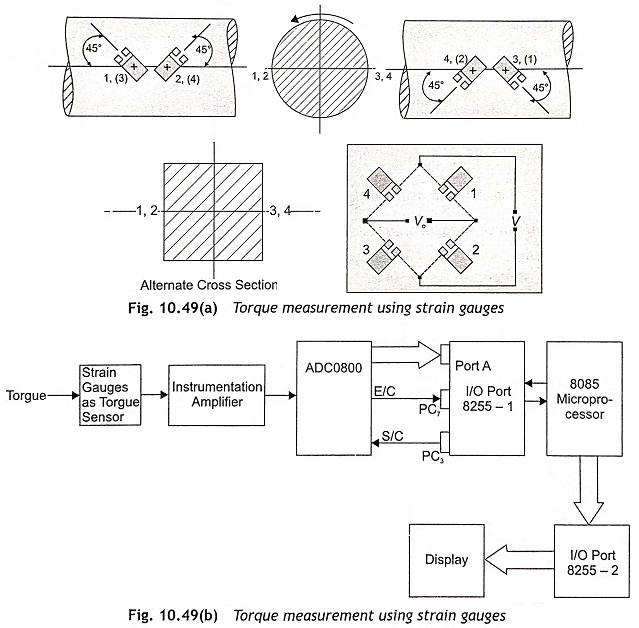
Generally, torque is transmitted through a rotating shaft between a power source and a power sink. Strain gauges are commonly used in torque cells. Figures 10.49 (a) and (b) show the torque measurement using strain gauges. Here, four strain gauges are mounted on the shaft. Strain gauges 1 and 3 are compressed, but strain gauges 2 and 4 are under tension due a torque in the shaft. The strain of the strain gauge 1 is approximately
![]()
where
- T = torque,
- G = E/2(1+υ) = shear modulus,
- r = radius of shaft.
The relationship between strains of all four gauges is e2 = e4 = -e1 = -e3. When all four gauges are connected in bridge form as shown in Fig. 10.50, the output voltage can be expressed as
![]()
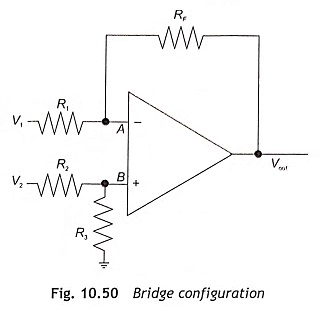
The output of bridge circuit fed to a differential amplifier using an operational amplifier as shown in Fig. 10.50, and output voltage becomes measurable. The microprocessor can be used to measure this voltage and display it in seven-segment display after proper calibration based on a look-up table.
R1 = R2
Pressure Measurement
Pressure is the force per unit area. Pressure is usually specified as a difference between the process variable measured and some reference pressure. This can be visualized as the pressure on a diaphragm, with the pressure being measured on one side and the reference pressure on the other. That reference pressure defines the type of pressure measured:
Absolute: Reference pressure is zero.
Gauge: Reference pressure is the environment air pressure. Automobile tire pressure is gauge pressure.
Differential: The reference pressure is a second process variable being measured.
Types of pressure transducers are large-displacement transducers and small-displacement transducers. Large displacement transducer consists of a variety of flexible containers that change size with pressure. Small-displacement transducers usually consist of a diaphragm and a strain gauge.
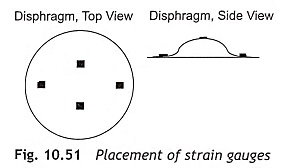
Small-displacement pressure transducers consist of a diaphragm, one side exposed to pressure being measured and the other side exposed to reference pressure. Displacement of a diaphragm measured by a capacitive or inductive displacement transducer or strain of diaphragm measured using strain gauges. The placements of strain gauges are shown in Fig. 10.51. Center of the diaphragm is convex, and a part near the edge is convex. Strain gauges can be placed so that there are complementary pairs.
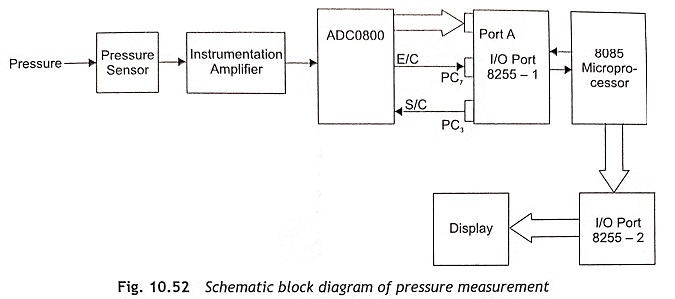
Nowadays integrated pressure sensors are available in the market and are used as a small-displacement pressure transducer. The entire sensor is fabricated on one silicon chip and the diaphragm is etched into silicon. Strain gauges are fabricated on silicon and signal conditioning circuit is present on the same chip. The schematic block diagram for pressure measurement is shown in Fig. 10.52. The programming of pressure measurement will be same as force measurement, but the look-up table must be modified as per required calibration.
Temperature Measurement
Temperature is widely measured and controlled in industrial process control system. For temperature measurement, one of the following devices are used:
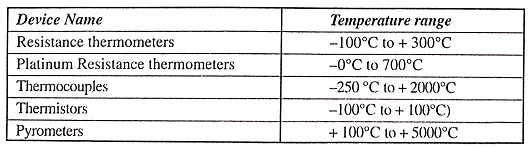
Platinum wires are frequently used in resistance thermometers for industrial application because of their greater resolution, and mechanical and electrical stability as compared to copper or nickel wires. A change in temperature causes a change in resistance. The resistance thermometer is placed in an arm of a Wheatstone bridge to get a voltage proportional to temperature. A thermistor is a semiconductor device fabricated from a sintered mixture of metal alloys, having a large negative temperature coefficient. A thermistor is used in a Wheatstone bridge to get a voltage proportional to temperature. The thermistor is a thermally sensitive variable resistor made of semiconductor material. The substance used may be oxides of nickel, copper, manganese, iron, cobalt, etc., usually a high negative temperature coefficient. It can be used in the range of -100 to +100° C for greater accuracy as compared to a platinum resistance thermometer. Positive thermistors are also used but in the low range of 50°C to + 100°C.
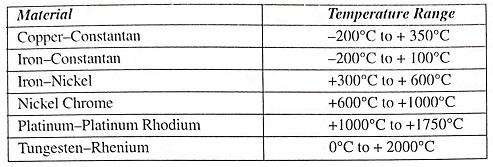
In industry, the most widely used temperature transducer is the thermocouple. This temperature transducer works on the principle that contact potential between two dissimilar metals changes with temperature. When two dissimilar metals are joined and the junctions are placed at two different temperatures, an emf is induced which will he used for temperature measurement. Thermocouple materials for different ranges of temperature are given below:
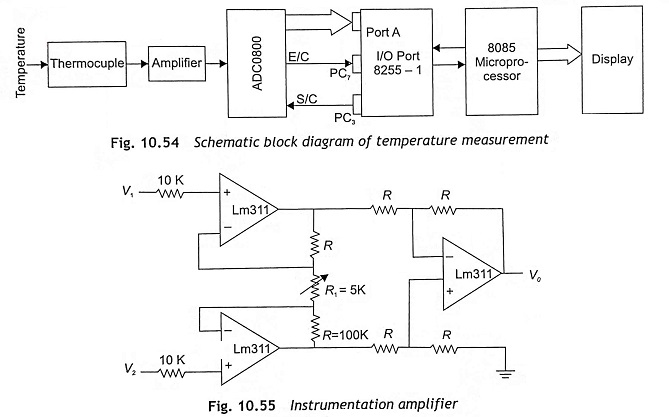
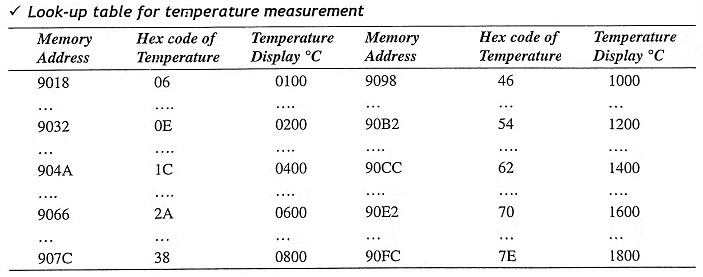
The microprocessor-based temperature measurement of an electrical furnace is shown in Fig. 10.54. Here, a thermocouple– is used as a sensor for temperature measurement. The output of a thermocouple is directly proportional to the furnace temperature, which is in millivolt range. As output voltage is not in a measurable condition, it must be amplified using an instrumentation amplifier. The amplified voltage is applied to an A/D converter. The microprocessor sends a start of conversion signal to the A/D converter through the port of 8255 PPI. When an A/D converter completes conversion, it sends an end-of-conversional signal to the microprocessor. Having received an end-of-conversion signal from the A/D converter, the microprocessor reads the output of the A/D converter, which is a digital quantity proportional to the temperature to be measured. Then the microprocessor displays the measured temperature.
Water-Level Indicator
A water-level indicator works by converting water levels into electrical signals and measures them by electrical or electronics circuits. The most simplest type water level indicator is the resistive method. This is also known as contact point type. A number of resistances of suitable values have their one end inserted in the column. Resistance may be a function of level.
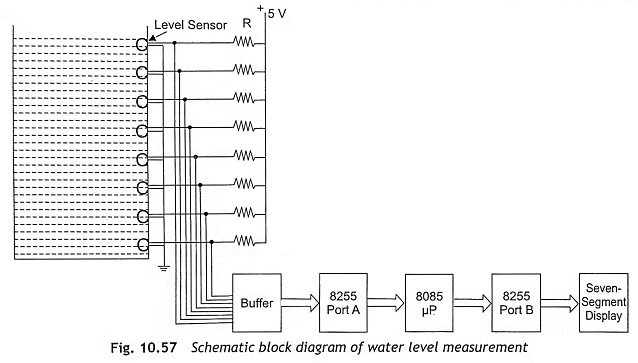
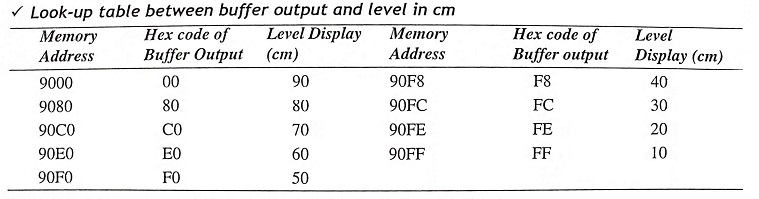
The microprocessor-based water level indicator is shown in Fig. 10.57. The contact-type level sensors are connected to + 5 V through series resistors and other terminals arc grounded and assume water tank is also at ground potential. When the level sensor is immersed in water, it will be at ground potential and its output will be logic 0. If the level sensor is not immersed in water, its output is + 5 V or logic 1. As shown in Fig. 1 0.57, there are eight level sensors, which are used to indicate eight different levels of the tank. The output of level sensors are connected to a buffer and buffer outputs are applied to Port A of 8255. The microprocessor reads the buffer output through Port A of 8255 and determines the water level based on look-up table, which is stored in the memory. After finding out the level, it will be displayed in a seven-segment display.
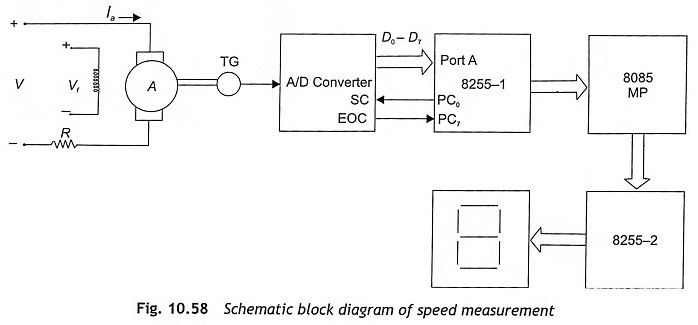
Measurement and Display of Speed of a Motor
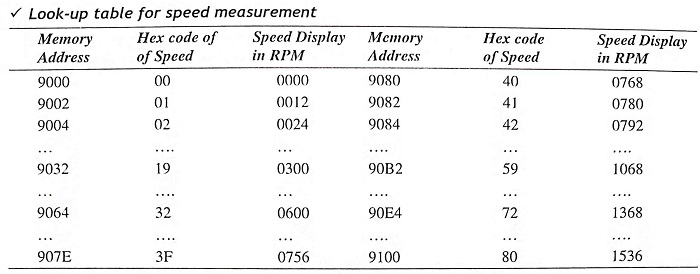
Figure 10.58 shows the microprocessor-based speed measurement. A tacho-generator is coupled at the shaft of the motor and generates a voltage proportional to the speed. The output of the tachogenerator (TG) used in this measurement scheme is 0 to 5 volts dc for speed variation of 0 to 1500 RPM. The output voltage is connected to ADC 0808 for analog-to-digital conversion. The output of the A/D converter is applied to Port A of 8255-1. Seven-segment display units are connected to Port A and Port B of 8255-2. The control word for both 8255-1 is 98H and 8255-2 is 80H. The look-up table consists of the hex code of techo-generator voltage and its corresponding speed in rpm. The microprocessor reads the digital output of the A/D converter for different speeds of the motor. After that, the microprocessor measures the speed using a look-up table and displays the speed of the motor in a seven-segment display.
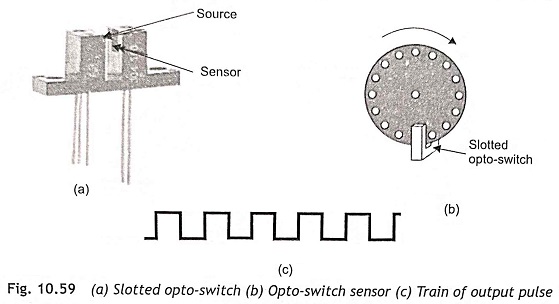
For better accuracy of measurement, the search-table properly calibrated. For this, each digital input voltage, and corresponding speed is measured accurately and stored in the memory location. For one digital input voltage, two memory locations are located in the search table where decimal data corresponding to the speed are stored. After getting a digital input corresponding to a speed, the speed will be searched from memory and displayed in the displayed screen. If we want to measure speed accurately, a train of pulses can be generated using a photoelectric switch sensor. Opto-switches consist of a light source and a light sensor within a single unit as shown in Fig. 10.59. This scheme of speed measurement has a light source, a semiconductor device sensitive to light and an attachment disc on the shaft containing a hole to pass light. The microprocessor will count the number of pulses per second, which is directly proportional to the speed.