Ideal Voltage Transfer Curve of Op Amp:
Ideal Voltage Transfer Curve of Op Amp – The ideal op-amp produces the output proportional to the difference between the two input voltages. The graphical representation of this statement gives the voltage transfer curve. It is the graph of output voltage Vo plotted against the difference input Voltage Vd, assuming gain constant. This graph is called transfer characteristics of the op-amp.
Now the output voltage is proportional to difference input voltage but only up to the positive and negative saturation voltages of op-amp. These saturation voltages are specified by the manufacturer in terms of output voltage swing rating of an ap-amp, for given value of supply voltages. These saturation voltages are slightly less than the supply voltages.
Thus, the voltage transfer curve is a straight line till output reaches saturation voltage level. Thereafter output remains constant. The Ideal Voltage Transfer Curve is shown in the Fig. 2.7.
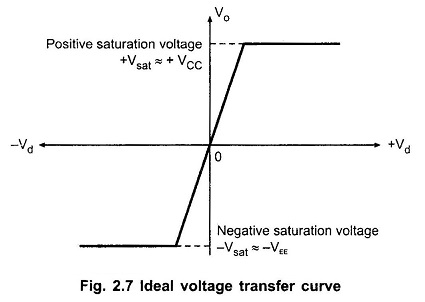
The curve is not drawn to the scale. If drawn to the scale, the curve would be almost vertical due to large values of op-amp gain.
Thus note that the op-amp output voltage gets saturated at +VCC and -VEE and it can not produce output voltage more than +VCC and -VEE. Practically saturation voltages +Vsat and -Vsat are slightly less than +VCC and -VEE.