Capability Curve of Synchronous Generator:
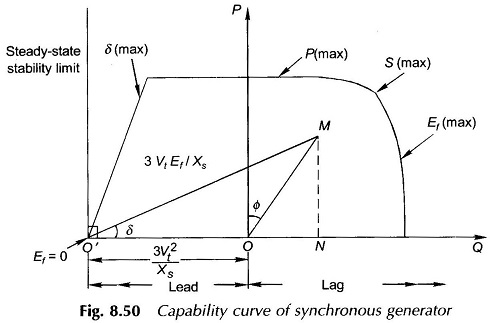
Capability Curve of Synchronous Generator defines the bounds within which it can operate safely. Various bounds imposed on the machine are:
- MVA-loading cannot exceed the generator rating. This limit is imposed by the stator heating.
- MW-loading cannot exceed the turbine rating which is given by MVA (rating) x pf (rating).
- The generator must operate a safe margin away from the steady-state stability limit (δ = 90°). This can be laid down as a maximum allowable value of δ
- The maximum field current cannot exceed a specified value imposed by rotor
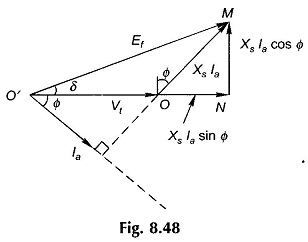
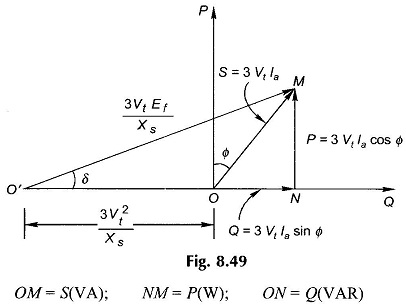
To draw the capability curve of the synchronous generator, its phasor diagram is used which is redrawn in Fig. 8.48; armature resistance is neglected. After multiplying voltage magnitude of each voltage phasor by (3Vt/Xs), the phasor diagram is redrawn in Fig. 8.49. It is immediately recognized that OMN is the complex power triangle (in 3-phase values) wherein
Obviously Q is positive for lagging power factor, Φ being the angle of OM from the P-axis. A mere scale change will convert these values to the units of MVA, MW and MVAR.
Constant S operation will lie on a circle centred at O and radius OM. Constant P operation will lie on a line parallel to QO′-axis. Constant-excitation (Ff) operation will lie on a circle centred at O′ of radius OM(3VtEf/Xs). Constant-pf operation will lie on a radial line through O.
Now with specified upper limits of S, P and Ef (field current), the boundaries of the capability curve can be drawn as in Fig. 8.50. The limit on the left side is specified by δ (max), the safe operating value from the point of view of transient stability.
Since the minimum excitation operation corresponds to δ = 90°, the machine operation is at a safe limit from Ef (min) by specifying δ (max).
The capability curve of the synchronous motor can be similarly drawn and will lie in the lower half of the PQ-plane and “lag” and “lead” regions will interchange.

