Basic Oscilloscope Patterns:
CRO is a very versatile instrument in laboratory for measurement of voltage, current, frequency and phase angle of any electrical quantity. But before we go ahead with discussion on measurement of electrical quantities with CRO, we should understand some basic oscilloscope patterns.
Assume that a sinusoidal voltage signal is applied to the horizontal deflection plates without applying any voltage signal to the vertical deflection plates, as shown in Fig. 51.18(a).
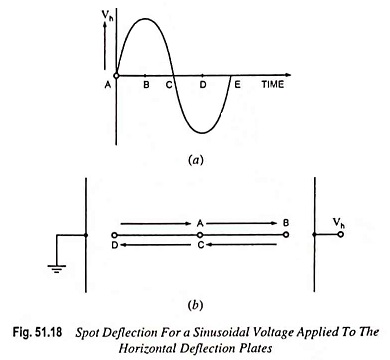
At point A in time, the voltage is zero so the spot remains undeflected at centre point of the screen. At point B in time, voltage Vh is maximum positive so the spot is at the extreme right end on the screen. At point C in time, once again the voltage is zero so the spot comes back to the central position on the screen. At point D in time, the voltage is maximum negative and so the spot is at the extreme left end on the screen. At point E in time, the voltage is zero so the spot returns to the central position of the screen. In this way for next voltage cycle the spot again moves from point A to point B on the screen. So we get a horizontal line on the screen. One thing is to be kept in mind that this horizontal line is in the central position vertically as no voltage has been applied to vertical deflection plates.
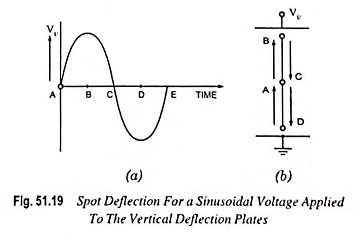
If sinusoidal voltage signal is applied to the vertical deflection plates without applying any voltage signal to horizontal deflection plates then we get a vertical line on the screen of CRO, as shown in Fig. 51.19. This line would be in the central position on the screen horizontally.
By this time we have seen what type of Oscilloscope Patterns we get when sinusoidal voltage signal is applied to horizontal or vertical deflection plates alone. Now we would discuss what happens when both horizontal and vertical deflection plates are supplied with sinusoidal voltage signals simultaneously.
Let us consider a case, when two sinusoidal voltage signals equal in magnitude and frequency and in phase are applied to both of the horizontal and vertical deflection plates, as shown in Fig. 51.20(a) and (b).
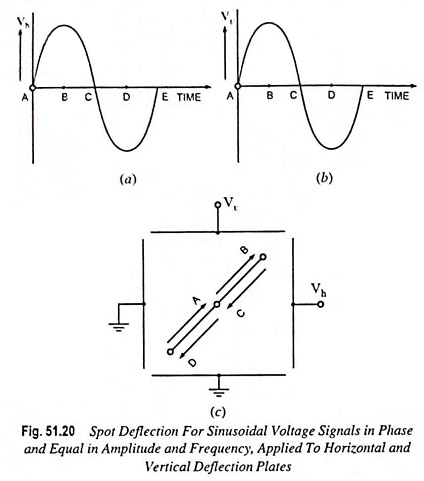
At point A in time, voltages at both of the plates are zero so the spot is in the centre of the screen. At point B in time, voltages applied to both of the plates are maximum positive, so the spot appears at the extreme right end in horizontal direction and extreme upward in the vertical direction. At point C in time, again both voltages are zero so the spot moves back to centre of the screen. At point D in time, voltages applied to both of the plates are maximum negative, so the spot appears at the extreme left end in the horizontal direction and extreme downward in the vertical direction. As both of the voltage signals are in phase and equal in amplitude and frequency, so at any time voltage signals applied to horizontal and vertical deflection plates are equal in magnitude as well as in sign. That is why, at any instant movement of the spot is same in horizontal (X-axis) as well as in vertical (Y-axis) directions. Thus a straight line inclined at 45° to the positive X-axis is obtained on the screen, as shown in Fig. 51.20(c).
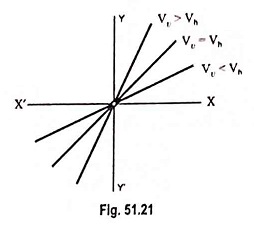
Here it is very important to note that at any time the movement of the spot on the screen is the vector sum of the horizontal and vertical deflections and the horizontal and vertical deflections are proportional to the voltages applied to the horizontal and vertical deflection plates respectively. So if sinusoidal voltage signals, in phase, and equal in amplitude and frequency are applied to horizontal and vertical deflection plates we get a straight line inclined at 45° to the + ve X-axis, as explained before. If amplitude of sinusoidal voltage signal applied to the vertical deflection plates is less than that of the voltage signal applied to horizontal deflection plates, then the deflection of the spot along Y-axis would he less than that along X-axis direction. So we get a straight line inclined at an angle, less than 45° to the + ve X-axis (Fig. 51.21). When voltage applied to the vertical deflection plates is more than that applied to the horizontal deflection plates, we will get a straight line inclined at an angle, more than 45° to + ve X-axis (Fig. 51.21).
Now let us consider a case when two sinusoidal voltage signals applied to the horizontal and vertical deflection plates are of equal magnitude but opposite in phase, as shown in Fig. 51.22(a) and (b).
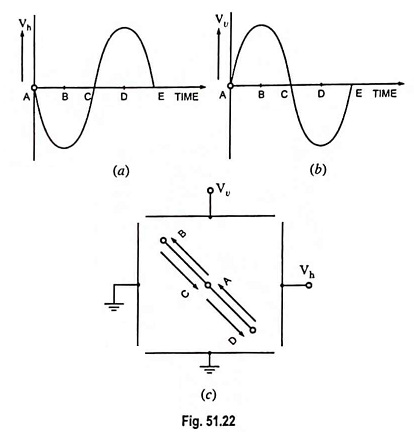
At point A in time, both voltage signals are zero so the spot is at the central position of the screen. At point B in time, voltage applied to horizontal deflection plates is maximum – ve while the voltage applied to the vertical deflection plates is maximum + ve, so the spot moves a maximum distance to the left and upward, as shown in Fig. 51.22(c). Similarly at point C in time the spot comes back to the central position of the screen and at point D in time, it goes to maximum right and downward, as shown in the Fig. Thus we get a straight line inclined at 135° to the + ve X-axis, as shown in Fig. 51.22(c).
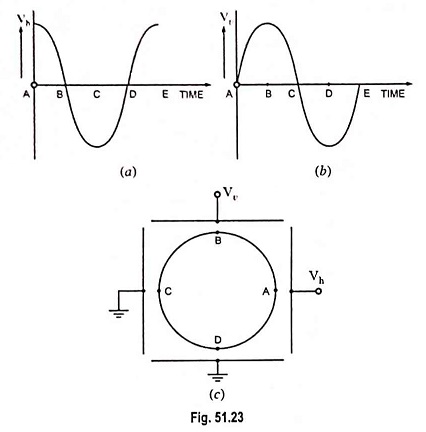
In third case, if the two sinusoidal voltage signals, 90° out of phase and of equal amplitude and equal frequency, are applied to the horizontal and vertical deflection plates, a circle would appear on the screen, as shown in Fig. 51.23. At point A in time, voltage applied to the horizontal deflection plates is maximum + ve and the voltage applied to the vertical deflection plates is zero, so the spot moves extreme right end on the X-axis without any movement along the Y-axis. At point B in time, the voltage applied to horizontal deflection plates is zero but the voltage applied to the vertical deflection plates is maximum + ve, so the spot moves maximum in upward direction without any horizontal movement. Similarly the spot moves, for points C and D in time, on the screen, as shown in Fig. 51.23. Thus during one cycle of sine wave, the spot traces out a circle on the screen.
It can also be proved theoretically, that during one complete cycle of the sine wave, the spot traces out a circle on the screen of the CRO. Let at any instant dh be the deflection of the spot along X-axis and dv be the deflection along Y-axis. Then resultant deflection of the spot, d would be
![]()
Since the deflection is proportional to the applied voltage vh = Vh cos ωt and vv = Vv sinωt,
![]()
and
![]()
Substituting the above values of dh and dv in Eq (51.13) we have
![]()
Since both voltage signals are of equal amplitudes,
![]()
Substituting Dh = Dv = D in Eq (51.14) we have
![]()
From the above expression it is obvious that the deflection of the spot, d from the centre of the screen is constant and equal to D at any time of the sinusoidal cycle. Thus it is proved that the spot traces out a circle on the screen as it moves from point A to B to C and so on.
So far we have considered the case of sinusoidal voltage signals of equal frequency and equal amplitude with phase difference of 0°, 90° and 180° between them. From analogy it can be easily understood that the Oscilloscope Patterns for any intermediate angle would be an ellipse, as shown in Fig. 51.24.
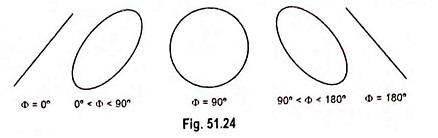
When voltage signals are of equal amplitudes and equal frequency, major axis of an ellipse makes either 45° or 135° angle with the + ve X-axis. But when voltage signals are of different amplitudes but of equal frequency then major axis of the ellipse makes different angles depending on the difference in amplitudes of voltage signals. An increase in the vertical deflection voltage causes major axis of the ellipse to make an angle larger than 45° or less than 135°. On the other hand a large horizontal deflection voltage causes major axis of the ellipse to make angle shorter than 45° or larger than 135°.