Selectivity Measurement Receiver:
The Selectivity Measurement Receiver is its ability to reject, (adjacent) unwanted signals. It is expressed as a curve, such as the one in Fig. 16.5, which shows the attenuation that the receiver offers to signals at frequencies near the one to which it is tuned. Selectivity is measured at the end of a sensitivity test under the same conditions, except that now the frequency of the generator is varied to either side of the frequency to which the receiver is tuned.
The output of the receiver obviously falls (attenuation increases), since the frequency is incorrect. Hence the input voltage must be increased until the output is the same as it was originally. The ratio of the voltage required at resonance to the voltage required when the generator is tuned to the receivers frequency is calculated at a number of points and then plotted in decibels, to give the curve shown in Fig. 16.5.
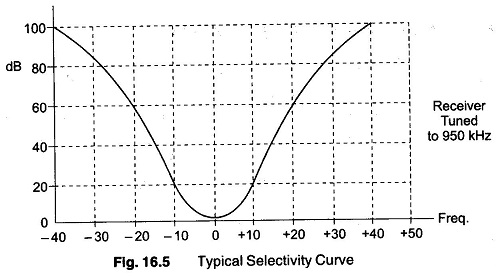
From the curve, it can be seen that at 20 kHz below the receiver tuned frequency, an interfering signal would have to be 60 db greater than the wanted signal, to come out with the same amplitude.
Selectivity varies with receiving frequency if ordinary tuned circuits are used in the IF section, and becomes somewhat worse when the receiving frequency is raised.