Digital Readout Oscilloscope:
The Digital Readout Oscilloscope instrument has a CRT display and a counter display. The diagram shown is of an instrument where the counter measures the time (Fig. 7.29).
The input waveform is sampled and the sampling circuit advances the sampling position in fixed increments, a process called strobing. The equivalent time between each sample depends on the numbers of sample taken per cm and on the sweep time/cm, e.g. a sweep rate of 1 nano-sec/cm and a sampling rate of 100 samples/cm gives a time of 10 pico-sec/sample.
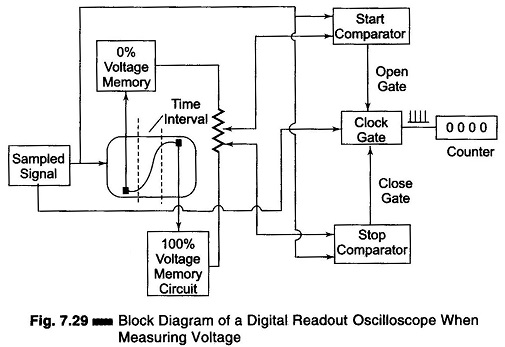
Figure 7.29 shows a block diagram of a digital read out oscilloscope when measuring voltage.
Two intensified portions of the CRT trace identify 0% and 100% zones position. Each zone can be shifted to any part of the display. The voltage divider taps between the 0% and 100% memory voltage are set for start and stop timing. The coincidence of any of the input Waveforms with the selected percentage point is sensed by this voltage comparator. The numbers of the clock pulse which correspond to the actual sample taken are read out digitally in a Nixie display tube in ns, lis, ms or seconds.
Figure 7.30 shows a block diagram of a digital readout CRO when used for voltage to time conversion.
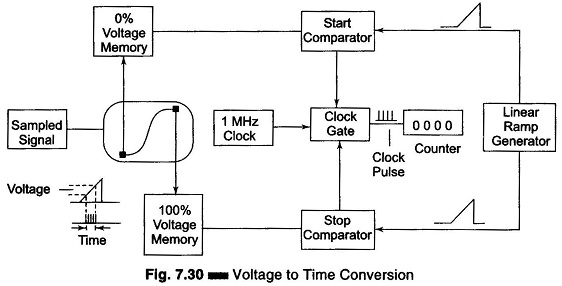
The CRT display is obtained by sampling the 0% reference voltage as chosen by the memory circuit. A linear ramp generator produces a voltage; when the ramp voltage equals the 0% reference the gate opens. When the ramp equals 100% reference the gate closes. The number of clock pulses that activate the counter is directly proportional to the voltage between the selected reference and is read out in mV or volts by the Nixie tube display.