XY Recorder Working:
XY Recorder Working – In most research fields, it is often convenient to plot the instantaneous relationship between two variables [Y = f(x)], rather than to plot each variable separately as a function of time.
In such cases, the X-Y recorder is used, in which one variable is plotted against another variable. In an analog X-Y recorder, the writing head is deflected in either the x-direction or the y-direction on a fixed graph chart paper. The graph paper used is generally squared shaped, and is held fixed by electrostatic attraction or by vacuum.
The writing head is controlled by a servo feedback system or by a self balancing potentiometer. The writing head consist of one or two pens, depending on the application. In practice, one emf is plotted as a function of another emf in an X-Y recorder.
In some cases, the X-Y recorder is also used to plot one physical quantity (displacement, force, strain, pressure, etc.) as a function of another physical quantity, by using an appropriate transducer, which produces an output (EMF) proportional to the physical quantity.
The motion of the recording pen in both the axis is driven by servo-system, with reference to a stationary chart paper. The movement in x and y directions is obtained through a sliding pen and moving arm arrangement.
A typical block diagram of an XY Recorder Working is illustrated in Fig. 12.9.
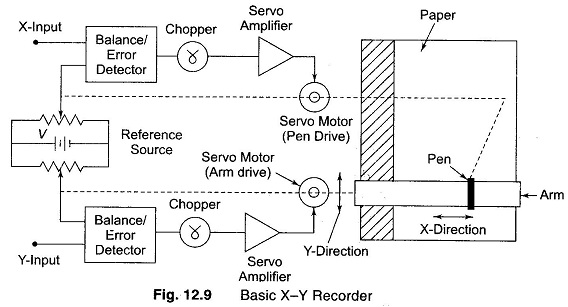
Referring to Fig. 12.9, each of the input signals is attenuated in the range of 0-5 mV, so that it can work in the dynamic range of the recorder. The balancing circuit then compares the attenuated signal to a fixed internal reference voltage. The output of the balancing circuit is a dc error signal produced by the difference between the attenuated signal and the reference voltage. This dc error signal is then converted into an ac signal with the help of a chopper circuit. This ac signal is not sufficient to drive the pen/arm drive motor, hence, it is amplified by an ac amplifier. This amplified signal (error signal) is then applied to actuate the servo motor so that the pen/arm mechanism moves in an appropriate direction in order to reduce the error, thereby bringing the system to balance. Hence as the input signal being recorded varies, the pen/arm tries to hold the system in balance, producing a record on the paper.
The action described above takes place in both the axes simultaneously. Hence a record of one physical quantity with respect to another is obtained.
Some X-Y recorders provides x and y input ranges which are continuously variable between 0.25 mV/cm and 10 V/cm, with an accuracy of ± 0.1% of the full scale. Zero offset adjustments are also provided.
The dynamic performance of X-Y recorders is specified by their slewing rate and acceleration. A very high speed X-Y recorder, capable of recording a signal up to 10 Hz at an amplitude of 2 cm peak to peak, would have a slewing rate of 97 cm/s and a peak acceleration of 7620 cm/s.
An XY Recorder Working may have a sensitivity of 10 µV/mm, a slewing speed of 1.5 ms and a frequency response of about 6 Hz for both the axis. The chart size is about 250 x 180 mm. The accuracy of X-Y recorder is about ± 0.3%.
Applications of X-Y Recorders:
These recorders are used to measure the following.
- Speed-torque characteristics of motors.
- Regulation curves of power supply.
- Plotting characteristics of active devices such as vacuum tubes, transistors, zener diode, rectifier diodes, etc.
- Plotting stress-strain curves, hysteresis curves, etc.
- Electrical characteristics of materials, such as resistance versus temperature.
Digital X–Y Plotters:
The rapid increase in the development in digital electronics has led to the replacement of analog X-Y recorders by digital X-Y plotters. The latter provide increased measurement and graphics capabilities. Digital X-Y plotters use an open loop stepping motor drive, in place of the servo motor drive used in analog X-Y recorders.
Digital measurement plotting systems provide the following features:
- Simultaneous sampling and storage of a number of nput channels.
- A variety of trigger modes, including the ability to display pre-triger data.
- Multi-pen plotting of the data.
- Annotation of the record with date, time and set up conditions.
- An ability to draw grids and axis.
Communication with such devices can be by means of the EEE 488 or RS232 interface.
Graphic plotters are used to obtain hard copy from digital data input. By the use of appropriate software and hardware, these devices can draw grids, annotate charts and differentiate data by the use of different colours and line types. They are specified by their line quality, plotting speed and paper size.