Voltage Profile of Transmission Line:
Control of Voltage Profile of Transmission Line at the receiving bus in the fundamental two-bus system was discussed already. Though the same general conclusions hold for an interconnected system, it is important to discuss this problem in greater detail.
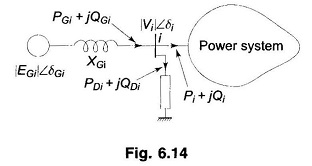
At a bus with generation, voltage can be conveniently controlled by adjusting generator excitation. This is illustrated by means of Fig. 6.14 where the equivalent generator at the ith bus is modelled by a synchronous reactance (resistance is assumed negligible) and voltage behind synchronous reactance.
With (PGi + jQGi) and |Vi| ∠δi given by the load flow solution, these values can be achieved at the bus by adjusting generator excitation to give |EGi| as required by Eq. (6.90) and by adjusting the governor setting so that power input to generator from turbine is PGi plus losses, resulting in load angle of (δGi – δi) corresponding to Eq. (6.89). If QGi demand exceeds the capacity of generators, VAR generators (synchronous or static capacitor) have to be used to modify the local load.
If follows from above that to control the Voltage Profile of Transmission Line of an inter-connected system, buses with generators are usually made PV (i.e. voltage control) buses. Load flow solution then gives the voltage levels at the load buses. If some of the load bus voltages work out to be less than the specified lower voltage limit, it is indicative of the fact that the reactive power flow capacity of transmission lines for specified voltage limits cannot meet the reactive load demand (reactive line flow from bus i to bus k is proportional to |ΔV| = |Vi| – |Vk|). This situation can be remedied by installing VAR generators at some of the load buses. These buses in the load flow analysis are then regarded as PV buses with the resulting solution giving the requisite values of VAR (jQC) injection at these buses.
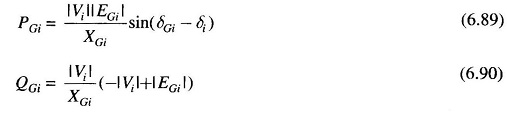
The fact that positive VAR injection at any bus of an interconnected system would help to raise the voltage at the bus is easily demonstrated below: Figure 6.15a shows the Thevenin equivalent circuit of the power system as seen from the ith bus. Obviously, Eth = Vi. If now jQC from VAR generator is injected into this bus as shown in Fig. 6.15b, we have from Equation
![]()
or
![]()
Since we are considering a voltage rise of a few percent, |Vi′| can be further approximated as
![]()
Thus the VAR injection of +jQc causes the voltage at the ith bus to rise approximately by (Xth/|Vi|)QC. The voltages at other load buses will also rise owing to this injection to a varying but smaller extent.
Control by Transformers:
Apart from being VAR generators, transformers provide a convenient means of controlling real power, and reactive power flow along a transmission line. As has already been clarified, real power is controlled by means of shifting the phase of voltage, and reactive power by changing its magnitude. Voltage magnitude can be changed by transformers provided with tap changing under load (TCUL) gear. Transformers specially designed to adjust voltage magnitude or phase angle through small values are called regulating transformers.
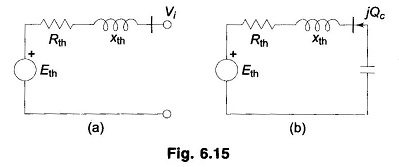
Figure 6.16 shows a regulating transformer for Control of Voltage Profile of Transmission Line magnitude, which is achieved by adding in-phase boosting voltage in the line. Figure 6.17a shows a regulating transformer which shifts voltage phase angle with no appreciable change in its magnitude. This is achieved by adding a voltage in series with the line at 90° phase angle to the corresponding line to neutral voltage as illustrated by means of the phasor diagram of Fig. 6.17b. Here
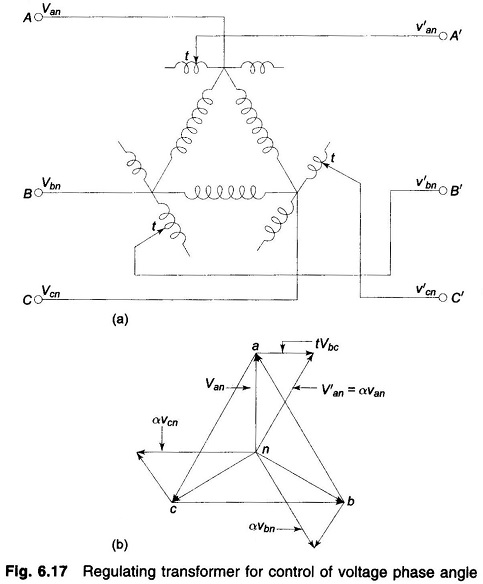
![]()
where α = (1-j√3t)≈1∠-tan-1√3t
since t is small.
The presence of regulating transformers in lines modifies the YBUS matrix thereby modifying the load flow solution. Consider a line, connecting two buses, having a regulating transformer with off-nominal turns (tap) ratio α included at one end as shown in Fig. 6.18a. It is quite accurate to neglect the small impedance of the regulating transformer, i.e. it is regarded as an ideal device. Figure 6.18b gives the corresponding circuit representation with line represented by a series admittance.
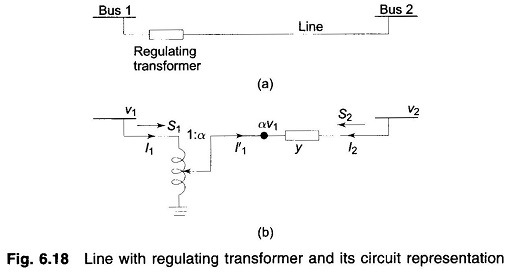
Since the transformer is assumed to be ideal, complex power output from it equals complex power input, i.e.
![]() or
or
![]()
For the transmission line
![]()
or
![]()
Also
![]()
Equations (6.94) and (6.95) cannot be represented by a bilateral network. The Y matrix representation can be written down as follows from Eqs. (6.94) and (6.95).
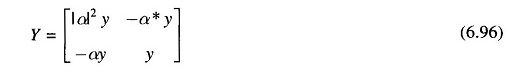
The entries of Y matrix of Eq. (6.96) would then be used in writing, the YBUS matrix of the complete power network.
For a voltage regulating transformer α is real, i.e. α* = α, therefore, Eqs. (6.94) and (6.95) can be represented by the π-network of Fig. 6.19.
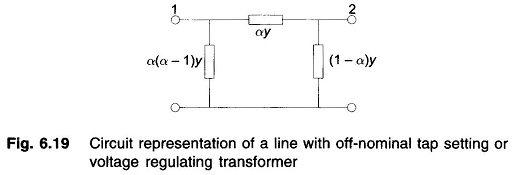
If the line shown in Fig. 6.18a is represented by a π-network with shunt admittance y0 at each end, additional shunt admittance |α|2y0 appears at bus 1 and y0 at bus 2.
The above derivations also apply for a transformer with off-nominal tap setting where