Stability from Log Magnitude Angle Diagram:
Yet another way of portraying the frequency response is to draw a curve showing the Log Magnitude Angle Diagram in decibels on the Y-axis and phase angle on the x-axis. The frequency ω is varied from —∞ to ∞ by combining the Log Magnitude and phase plots (Fig. 6.24). Thus the frequency is a parameter. This will be a closed contour for minimum phase functions.
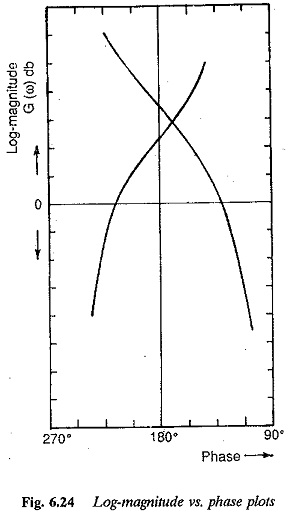
The stability can also be ascertained from this diagram, when one is interested in stability, it is sufficient to draw the curve in the range of frequencies from 0 to ∞ for minimum phase functions. Translating the Nyquist criterion (Bode plots) which states that the phase margin and gain margin must be positive for minimum phase functions, a thumb rule can be given for determining the stability of the system decided by the disposition of this curve with respect to the (0 db, —180°) point. As the curve is traced in the direction of increasing frequency, if this point lies to the right of the curve the system is stable. The relative stability of the system can also be ascertained from the nearness of this curve to the point. Nearer the curve to this point, the gain and phase margins also decrease. The system approaches cross-over; phase cross-over frequencies are marked on the figure.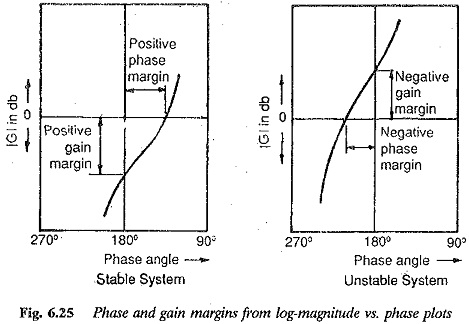
The advantages of the curve are obvious: The curve affords a quick estimation of relative stability and the design of compensation can be worked out easily. The stability of conditionally stable systems can be investigated very easily using these plots. Log Magnitude Angle Diagram versus angle plots of a conditionally stable system cross the —180° axis more than once. Stability analysis and range of parameters (e.g., gain) for stable operation may be obtained using this curve. The effect of changing the parameters on the stability can be investigated using this curve. For example, increasing the gain shifts the curve upwards without changing the angle characteristic. This results in a decrease of both phase and gain margins and the system becomes less stable.