Magnitude Plot and Phase Angle Plot:
Magnitude Plot and Phase Angle Plot – As mentioned earlier, the polar coordinate system is very commonly used to obtain the frequency response. The frequency ω is always an independent variable while the magnitude part and phase angle part are the two dependent variables.
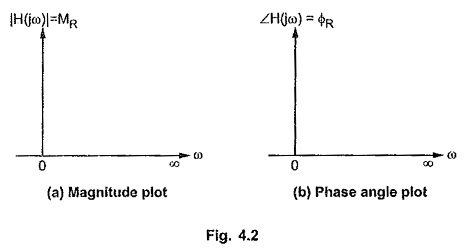
The graph of magnitude of the network function |H(jω)| i.e. MR, obtained against the values of ω varied in the range 0 to ∞ is called magnitude plot of the frequency response. This is shown in the Fig. 4.2 (a).
The graph of phase angle of the network function ∠ H(jω) i.e. ΦR, obtained against the values of ω varied in the range 0 to ω is called phase angle plot of the frequency response. This is shown in the Fig. 4.2 (b).
The range of ω used is from 0 to ω and not from – ∞ to ∞ as laboratory generators can not produce negative values of ω.
To get the better idea of the frequency response, let us obtain the frequency response of a simple network function,
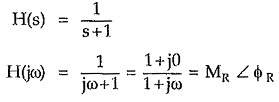
Now
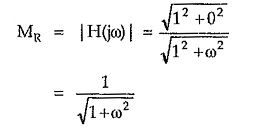
and
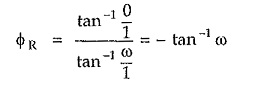
Preparing frequency response data in the tabular form,
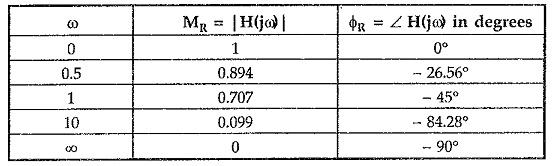
Thus the two plots can be obtained as shown in the Fig. 4.3.
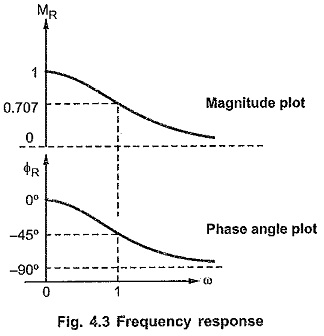
The frequency at which the magnitude is 0.707 times the maximum is called half power frequency and such specifications can be easily obtained once frequency response is sketched for the given network.
By this we are going to learn a logarithmic method of obtaining the frequency response and the corresponding specifications called Bode plot method.