Low Pass Filter:
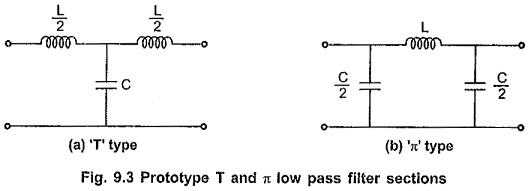
The prototype T and π low pass filter sections are as shown in the Fig. 9.3.
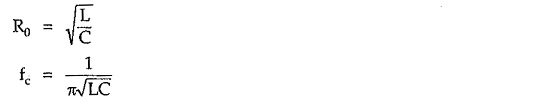
Design Impedance (R0):
Here in low pass filter sections,
Total series arm impedance Z1 = jωL
Total shunt arm impedance Z2 = -j/ωC
Hence, Z1 . Z2 = (jωL) (-j/ωC) = L/C which is real and constant. Hence sections are constant K sections so we can write,
Reactance Curves and Cut-off Frequency Expression:
As both T and π sections have same cut-off frequency, it is sufficient to calculate fc for the ‘T’ section only.
![]()
The reactance curves are as shown in the Fig. 9.4.
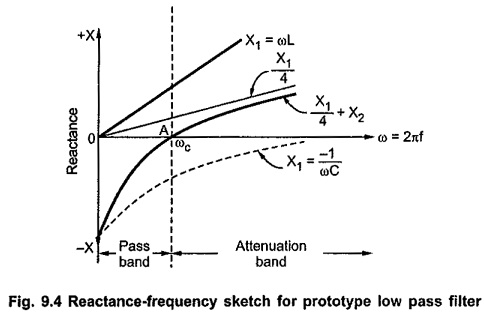
From above characteristic it is clear that all the reactance curves have positive slope as all curves slope upward to the right side with increasing ω.
The curves are on opposite sides of the frequency axis upto point A; while on the same side, from point A on wards. Hence all the frequencies upto point A give pass band and above point A give stop band. Thus point A marks cut-off frequency given by ω = ωc.
At point A, ω = ωc, the curve for (X1/4 + X2) crosses the frequency axis, hence we can write,
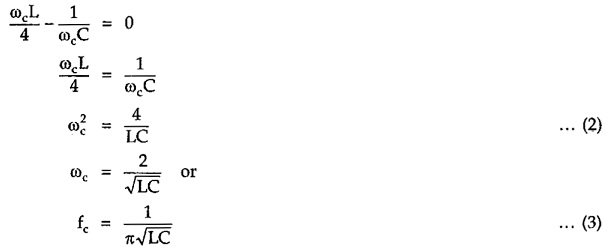
The algebraic approach to calculate cut-off frequency is as follows.
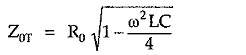
From above expression it is clear that, Z0T is real if ω2LC/4 < 1 and imaginary if ω2LC/4 > 1. Hence condition ω2LC/4 -1 = 0 gives expression,
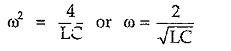
Thus, above prototype section passes all frequencies below ω = 2/√LC while attenuates all frequencies above this value. Therefore cut-off frequency of low pass filter is given by
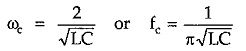
Above frequency comes out to be the same as calculated by reactance sketch method.
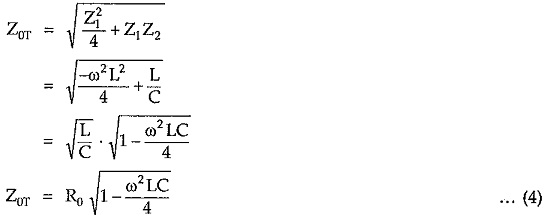
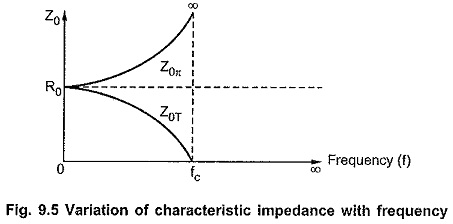
Variation of Z0T and Z0π with Frequency:
Consider expression
From equation (2), we can write
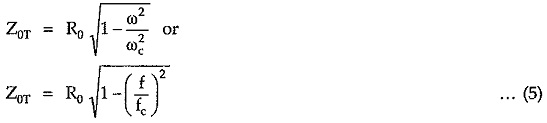
Similarly we can write,
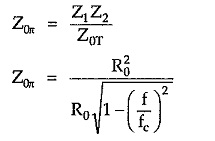
Hence
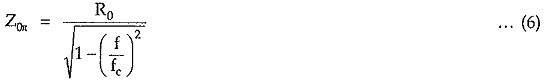
From equation (5), it is clear that as frequency increases from 0 to fc, Z0T decreases from R0 to 0 in passband. For π section, from equation (6), it is clear that in pass band as frequency increases for 0 to fc, Z0π increases from R0 to ∞.
The variation of Z0T and Z0π with frequency is as shown in the Fig. 9.5.
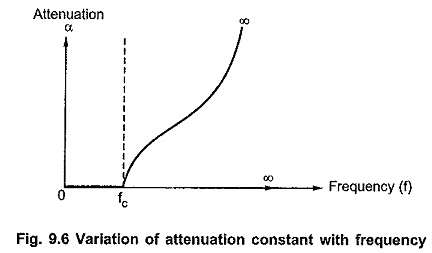
Variation of Attenuation Constant α with Frequency:
In pass band attenuation is zero. In stop band attenuation is given by,

In stop band, as frequency f increases above fc, attenuation also increases. The variation of α with frequency is as shown in the Fig. 9.6.
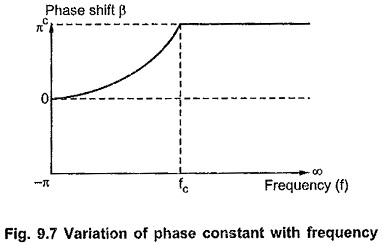
Variation of Phase Constant β with Frequency:
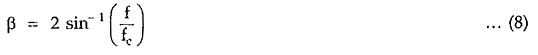
In stop band, phase constant β is always equal to π radian. In pass band where α = 0, the phase constant β is given by
As frequency increases from 0 to fc, β also increases from 0 to π radian. The variation of β with frequency is as shown in the Fig. 9.7.
Design Equations of Prototype Low Pass Filter:
The design impedance R0 and cut-off frequency fc can be given in terms of L and C as follows.
Dividing equation for R0 by fc, we get,

Multiplying equation for R0 and fc we get,
Equations (9) and (10) are called design equations for prototype low pass filter sections.