Classification of High Voltage Testing Methods:
Classification of High Voltage Testing Methods are divided into two groups:
- Power Frequency Withstand Voltage
- Impulse withstand voltage Tests
These tests together ensure the over voltage withstand capability of an apparatus. The Basics Terminology techniques of the technical terms are discussed here.
In test codes and standard specifications, certain technical terms are used to specify and define conditions or procedures. Hence, commonly used technical terms are
- Disruptive Discharge Voltage
- Withstand Voltage
- Fifty Per Cent Flashover Voltage
- Hundred Per Cent Flashover Voltage
- Creepage Distance
- A.C. Test Voltages
- Impulse Voltages
- Reference Atmospheric Conditions
Disruptive Discharge Voltage:
In this Classification of High Voltage Testing Methods which is defined as the voltage which produces the loss of dielectric strength of an insulation. It is that voltage at which the electrical stress in the insulation causes a failure which includes the collapse of voltage and passage of current. In solids, this causes a permanent loss of strength, and in liquids or gases only temporary loss may be caused.
Withstand Voltage:
The voltage which has to be applied to a test object under specified conditions in a withstand test is called the withstand voltage [as per IS: 731 and IS: 2099-1963].
Fifty Per Cent Flashover Voltage:
In this Classification of High Voltage Testing Methods which is the voltage which has a probability of 50% flashover, when applied to a test object. This is normally applied in Impulse withstand voltage Tests in which the loss of insulation strength is temporary.
Hundred Per Cent Flashover Voltage:
The voltage, that causes a flashover at each of its applications under specified conditions, when applied to test objects as specified, is hundred per cent flashover voltage.
Creepage Distance:
It is the shortest distance on the contour of the external surface of the insulator unit or between two metal fittings on the insulator.
A.C. Test Voltages:
Alternating Classification of High Voltage Testing Methods of Power Frequency Withstand Voltage should have a frequency range of 40 to 60 Hz and should be approximately sinusoidal. The deviation allowed from the standard sine curve is about 7%. The deviation is checked by measuring instantaneous values over specified intervals and computing the nns value, the average value, and the form factor.
Impulse Voltages:
Impulse voltages are characterized by polarity, peak value, time to front (tf), and time to half the peak value after the peak (tt). The time to front is defined as 1.67 times to time between 30% and 90% of the peak value in the rising portion of the wave. According to IS: 2071 (1973), standard impulse is defined as one with tf = 1.2 μs, tf = 50 μs (called 1.2/50 μs wave). The tolerances allowed are ± 3% on the peak value, ± 30% in the front time (tf), and ± 20% in the tail time (tt).
Reference Atmospheric Conditions:
The electrical characteristics of the insulators and other apparatus are normally referred to the reference atmospheric conditions. Since it is not always possible to do tests under these reference conditions, correction factors have to be applied. In some cases, the following test conditions are also used as reference (British Standard Specifications) conditions.
The flashover voltage of the test object is given by
![]()
where,
- Va = voltage under actual test conditions,
- Vs = voltage under reference atmospheric conditions,
- h = humidity correction factors, and
- d = air density correction factor.
The air density correction factor is given by,
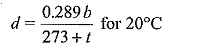
or
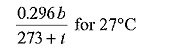
Where,
- b = atmospheric pressure in millibars, and
- t = atmospheric temperature, °C,
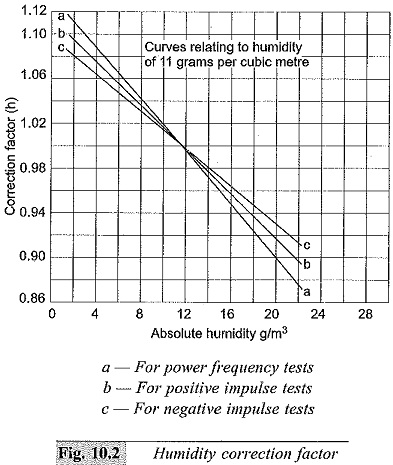
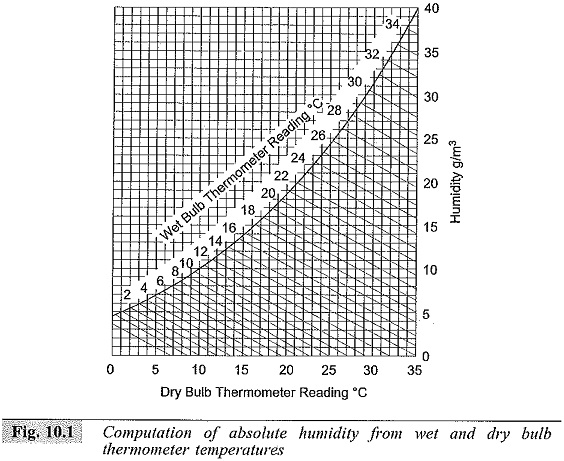
Humidity correction factor h is obtained from the temperatures of a wet and dry bulb thermometer, by obtaining the absolute humidity and then computing h from the absolute humidity. These are graphically given in Figs 10.1 and 10.2.