Statistical Analysis of Measurement Data:
The statistical analysis of measurement data is important because it allows an analytical determination of the uncertainty of the final test result. To make statistical analysis meaningful, a large number of measurements is usually required. Systematic errors should be small compared to random errors, because Statistical Analysis of Measurement Data cannot remove a fixed bias contained in all measurements.
Arithmetic Mean:
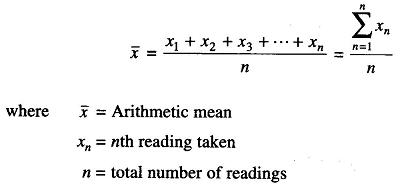
The most probable value of a measured variable is the arithmetic mean of the number of readings taken. The best approximation is possible when the number of readings of the same quantity is very large. The arithmetic mean of n measurements at a specific count of the variable x is given by the expression
Deviation from the Mean:
This is the departure of a given reading from the arithmetic mean of the group of readings. If the deviation of the first reading, x1, is called d1 and that of the second reading x2 is called d2, and so on,
The deviations from the mean can be expressed as
![]()
The deviation may be positive or negative. The algebraic sum of all the deviations must be zero.
Average Deviations:
The average deviation is an indication of the precision of the instrument used in measurement. Average deviation is defined as the sum of the absolute values of the deviation divided by the number of readings. The absolute value of the deviation is the value without respect to the sign.
Average deviation may be expressed as
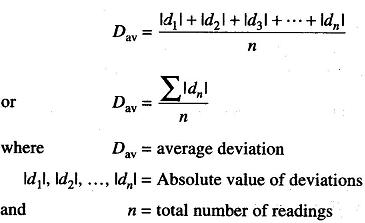
Highly precise instruments yield a low average deviation between readings.
Standard Deviation:
The standard deviation of an infinite number of data is the Square root of the sum of all the individual deviations squared, divided by the number of readings. It may be expressed as
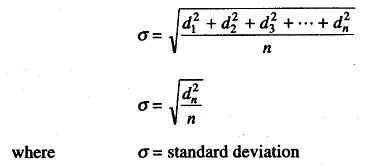
The standard deviation is also known as root mean square deviation, and is the most important factor in the Statistical Analysis of Measurement Data. Reduction in this quantity effectively means improvement in measurement.
For small readings (n < 30), the denominator is frequently expressed as (n – 1) to obtain a more accurate value for the standard deviation.
Limiting Errors:
Most manufacturers of measuring instruments specify accuracy within a certain % of a full scale reading. For example, the manufacturer of a certain voltmeter may specify the instrument to be accurate within ± 2% with full scale deflection. This specification is called the limiting error. This means that a full scale deflection reading is guaranteed to be within the limits of 2% of a perfectly accurate reading; however, with a reading less than full scale, the limiting error increases.