Generation of Impulse Current Generator Output Waveform:
Lightning discharges involve both high voltage impulses and high current impulses on transmission lines. Protective gear like surge diverters have to discharge the lightning currents without damage. Therefore, Generation of Impulse Current Generator Output Waveform of high magnitude ( ≈ 100 kA peak) find application in test work as well as in basic research on non-linear resistors.
Definition of Impulse Current Waveforms:
The waveshapes used in testing surge diverters are 4/10 and 8/20 μs, the figures respectively representing the nominal wave front and wave tail times (see Fig. 6.14). The tolerances allowed on these are ±10% only. Apart from the standard Impulse Current Generator Output Waveform, rectangular waves of long duration are also used for testing. The waveshape should be nominally rectangular in shape. The rectangular waves generally have durations of the order of 0.5 to 5 ms, with rise and fall times of the waves being less than ± 10% of their total duration. The tolerance allowed on the peak value is +20% and –0% (the peak value may be more than the specified value but not less). The duration of the wave is defined as the total time of the wave during which the current is at least 10% of its peak value.
Circuit for Producing Impulse Current Waves:
For producing impulse currents of large value, a bank of capacitors connected in parallel are charged to a specified value and are discharged through a series R-L circuit as shown in Fig. 6.20. C represents a bank of capacitors connected in parallel which are charged from a d.c. source to a voltage up to 200 kV. R represents the dynamic resistance of the test object and the resistance of the circuit and the shunt. L is an air cored high current inductor, usually a spiral tube of a few turns.
If the capacitor is charged to a voltage V and discharged when the spark gap is triggered, the current im will be given by the equation
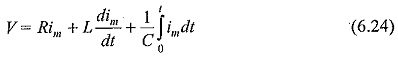
The circuit is usually underdamped, so that
![]()
Hence, im is given by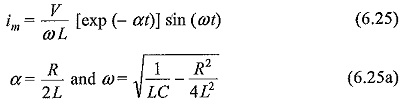
The time taken for the current im to rise from zero to the first peak value is
![]()
It can be shown that the maximum value of im is normally independent of the value of V and C for a given energy W = 1/2 CV2, and the effective inductance L.
It is also clear from Eq. (6.25) that a low inductance is needed in order to get high current magnitudes for a given charging voltage V.
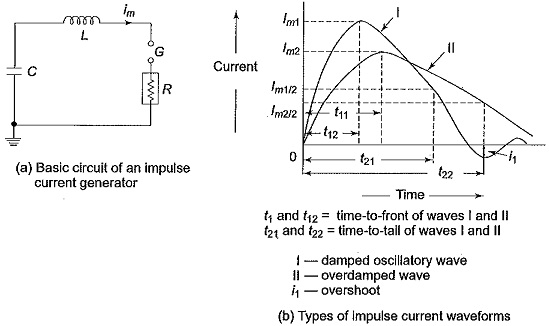
The present practice as per IEC standards is to adopt waveform II shown in Fig. 6.20, and to define the waveform and wave tail times similar to the definition given for impulse voltage waves. Thus, the current im is expressed as follows.
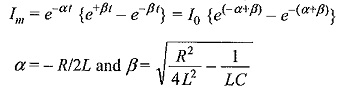
with this definition, time to front t1 = tf = 1/βtanh-1(β/α) and the time to tail t2 is a complex function of both β and α. For a 8/20 μS wave, the values of t1, t2 and peak value of Im are deduced as α= 0.0535 x 10⁶, β= 0.113 x 10⁶ and Im = VC/14 with LC = 65. Values of R, L and C are expressed in ohms, Hennes and Farads and V, I are expressed in kV and kA.
Generation of High Impulse Currents:
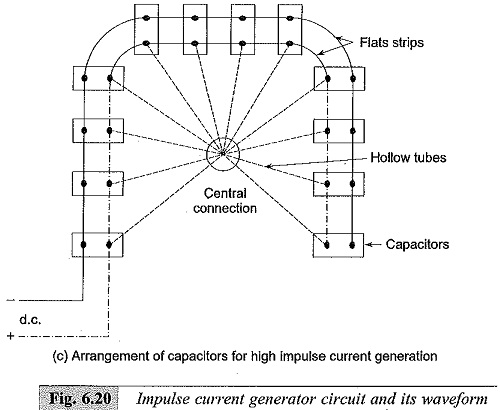
For producing large values of impulse currents, a number of capacitors are charged in parallel and discharged in parallel into the circuit. The arrangement of capacitors is shown in Fig. 6.20c. In order to minimize the effective inductance, the capacitors are subdivided into smaller units. If there are n1 groups of capacitors, each consisting of n2 units and if L0 is the inductance of the common discharge path, L1 is that of each group and L2 is that of each unit, then the effective inductance L is given by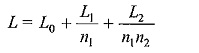
Also, the arrangement of capacitors into a horse-shoe shaped layout minimizes the effective load inductance (Plate 4). The essential parts of an Impulse Current Generator Output Waveform are:
- a d.c. charging unit giving a variable voltage to the capacitor bank,
- capacitors of high value (0.5 to 5 μF) each with very low self-inductance, capable of giving high short circuit currents,
- an additional air cored inductor of high current value,
- proper shunts and oscillograph for measurement purposes, and
- a triggering unit and spark gap for the initiation of the current
Generation of Rectangular Current Pulses:
Generation of rectangular current pulses of high magnitudes (few hundred amperes and duration up to 5 ms) can be done by discharging a pulse network or cable previously charged. The basic circuit for producing rectangular pulses is given in Fig. 6.21. The length of a cable or an equivalent pulse forming network is charged to a specified d.c. voltage. When the spark gap is short-circuited
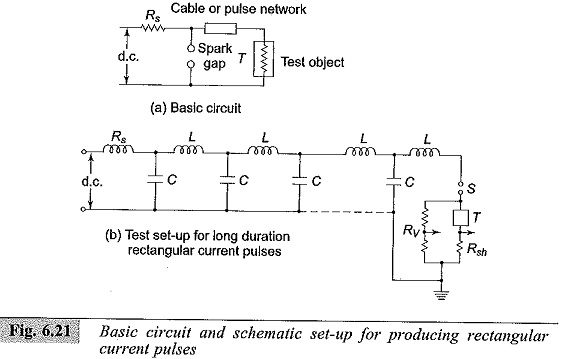
where
- Rs – Charging resistor
- S – Trigger spark gap
- T – Test object
- L–C – Pulse forming network
- Rv – Potential divider for voltage measurement
- Rsh – Current shunt for current measurement
To produce a rectangular pulse, a coaxial cable of surge impedance Z0 = √L0/C0 (where L0 is the inductance and C0 is the capacitance per unit length) is used. If the cable is charged to a voltage V and discharged through the test object of resistance R, the current pulse I is given by I= V/(Z0 + R). A pulse voltage RV/(R +Z0) is developed across the test object R, and the pulse current is sustained by a voltage wave (V-IR). For R = Z0, the reflected wave from the open end of the cable terminates the pulse current into the test object, and the pulse voltage becomes equal to V/2.
In practice, it is difficult to get a coaxial cable of sufficient capacitance and length. Often artificial transmission lines with lumped L and C as shown in Fig. 6.21 b are used. Usually, 6 to 9 L-C sections will be sufficient to give good rectangular waves. The duration of the pulse time in seconds (t) is given by t = 2 (n – 1) √LC, where n is the number of sections used, C is the capacitance per stage or section, and L is the inductance per stage or section.
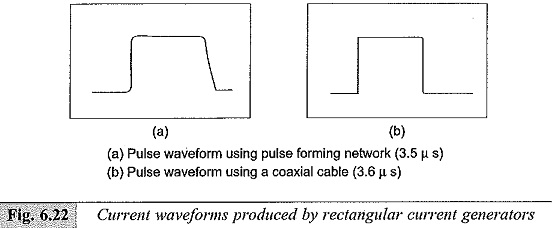
The current waveforms produced by an artificial line or pulse network and a coaxial cable are shown in Figs 6.22a and b.