Butterworth Approximation:
Butterworth Approximation – In low-pass filter design, we have to assume that all transmission zeros of the system function are at infinity. Then the magnitude function in general form can be written as,
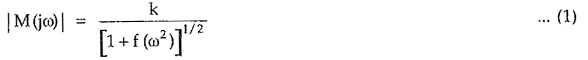
Where k is called as dc gain constant as it is the magnitude at ω = 0. f (ω2) is the polynomial which is selected to give the desired amplitude response.
Butterworth suggested that, let
![]()
where n is the order of filter.
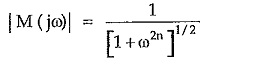
Then amplitude function can be written as
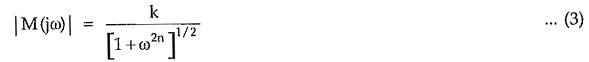
Above approximation is called as Butterworth approximation. It is also known as maximally flat response.
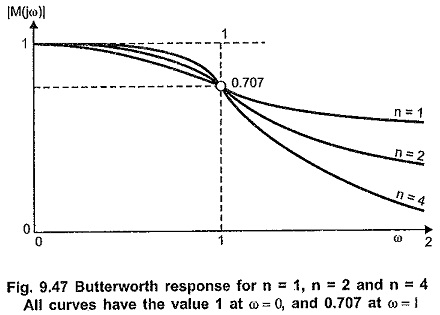
To get normalized Butterworth response assuming k = 1. The magnitude function M(jω) decreases monotonically with ω.
For any value of n i.e. for any order of the filter, at ω = 0.
![]()
Similarly, for any value of n i.e. for any order of the filter, at ω = 1, 12n = 1.

Thus at ω = 1, we get normalized cut-off frequency for any order of the filter. As the order of the filter increases approximate characteristics approaches ideal one. This indicates that for higher n, approximation is better. Thus order of the filter, i.e. n controls the closeness of approximation to the ideal response in pass band as well as in stop band. The Butterworth Approximation responses for different orders of filters are as shown in Fig.9.47.
From binomial series expansion, we can write,
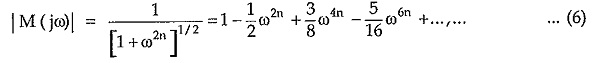
When above expression is differentiated with respect to ω, at ω = 0, it is observed that first (2n — 1) derivatives are zero. The derivative of system function is zero means the slope of graph or curve is zero. Thus graph is horizontal or flat, hence approximation is called maximally flat response.
Consider amplitude function given by,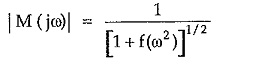 In pass band of filter, f (ω2) should be very small i.e. very less than 1. Then we can neglect f (ω2) and the amplitude function can be written as,
![]()
In stop band, f (ω2) should be very high i.e. much greater than 1. Then the amplitude function decreases as ω increases. Thus, in stop band, as frequency increases, response falls down giving low pass filter characteristics.
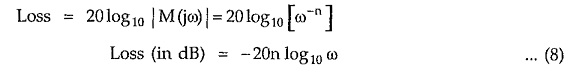
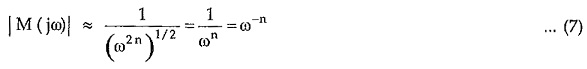
Let us consider attenuation in stop band. The magnitude response is given by
In stop band, ω2n is very large as compared to 1, hence the magnitude response is given by
The attenuation or loss expressed in dB is given by