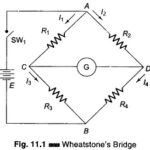
Wheatstone Bridge Diagram
Wheatstone Bridge Diagram: A Wheatstone Bridge diagram in its simplest form consists of a network of four resistance arms forming a closed circuit, with a dc source of current applied…
Continue Reading
Wheatstone Bridge Diagram