FFT Spectrum Analyzer Using a Waveform Processing Software(SS-36):
FFT Spectrum Analyzer – The Waveform Processing Software (SS-36) enables one to analyze waveforms very easily. The waveform is captured on a Digital Storage Oscilloscope (DSO) and is transferred to a PC via an RS 232 Serial Interface, which may be in-built in some DSOs.
Further, the software is programmed to work with almost any configuration of PC. The software automatically senses the system and configures itself for it (i.e. whether you are using a monochrome or colour monitor, whether you have a co-processor or not etc.).
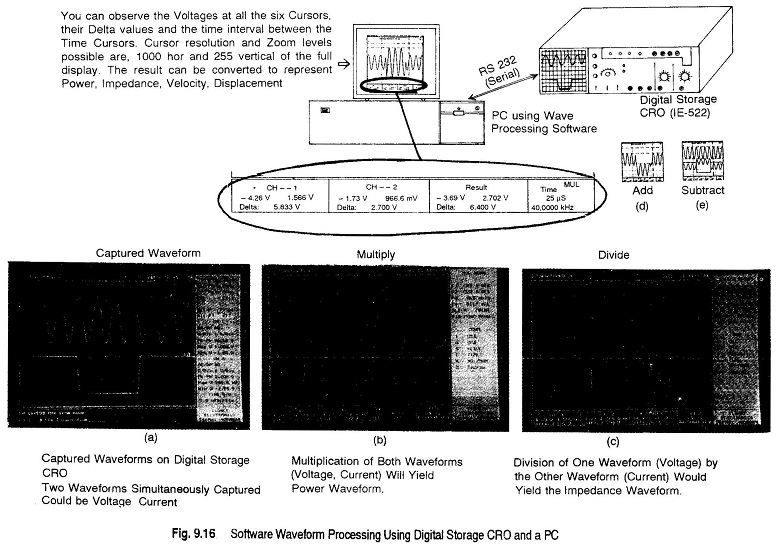
Suppose a voltage and current waveform in a circuit, is captured on a DSO. If the voltage is multiplied with the current, power is obtained and if voltage is divided by current, impedance is obtained. If this is done for all 1000 values of the voltage and the current captured on the DSO and plotted, a power and impedance curve is obtained. This process is performed by the software itself. The software can also perform multiplication, division, addition, and subtraction of two simple waveforms, as shown in Fig. 9.16. Figures 9.16(d) and (e) shows one waveform can be added and subtracted by another waveform using FFT analyzer.
FFT Spectrum Analyzer is also a very powerful tool. The conventional CRO gives a display of voltage versus time, but by using FFT, the amplitudes of the various frequencies that constitute the waveform can be obtained. The voltage versus frequency plot then shows the spectral content of the waveform. For instance, if a mains voltage is captured and analyzed, it harmonic content can be obtained.
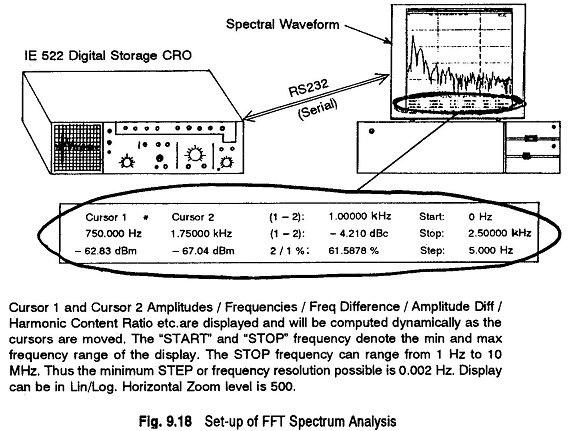
The frequency range of FFT Spectrum Analyzer is 0.002 Hz to 10 MHz. The minimum step or frequency resolution possible is 0.002 Hz. The display can be linear or logarithmic.
Another example of waveform processing is of an amplitude modulated signal (100 kHz modulated by 8 kHz). This waveform, along with its Fourier analysis, is illustrated in Fig. 9.17.
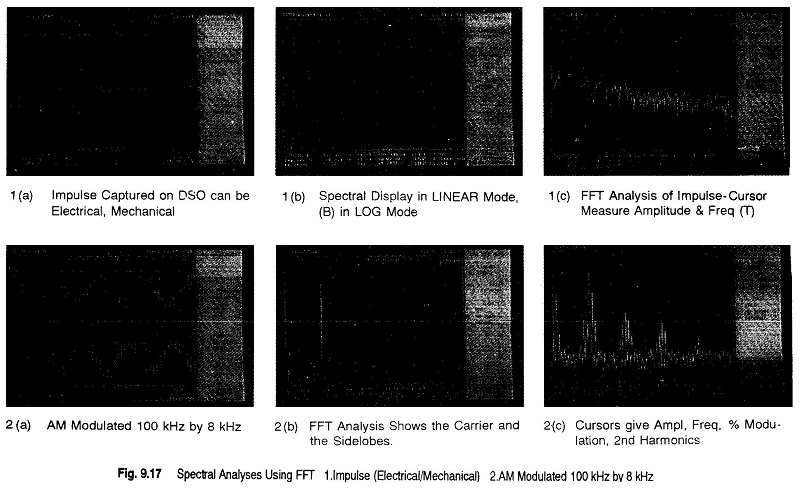
Figure 9.17(2a) shows a AM 100 kHz waveform modulated by 8 kHz, captured on a digital storage oscilloscope and on a PC.
Figure 9.17(2b) and (2c) shows its FFT analyzer (carrier and sidebands).
Figure 9.17(1a) illustrates the captured waveform of an electrical or mechanical impulse.
Figure 9.17(1b and 1c) shows the FFT spectral analysis.
Figure 9.18 Shows a pictorial set up of FFT Spectrum Analyzer.