S Domain Analysis Articles:
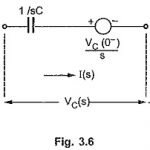
s domain: To Understand the concept of s domain network, let us see the below three points Single Resistor in s Domain Single Inductor in s Domain Single Capacitor in s Domain Single Resistor in s Domain: Consider a single resistor, carrying a current i(t) shown … (Read More)
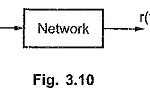 Transfer Function or Network Function: Every network is designed to produce a particular output, when input is applied to it. The network performance is judged by studying its output for the applied input. The output is the effect of network parameters … (Read More)
Driving Point Function and Transfer Function: For a given network, the ratio of Laplace transform of the source voltage and source current is called driving point function. If it is a ratio of source voltage to source current, it is called … (Read More)
Poles and Zeros of Network Function: All the Poles and Zeros of Network Function have the form of a ratio of two polynomials in s as, The P(s) is the numerator polynomial in s having degree m while the Q(s) is the … (Read More)
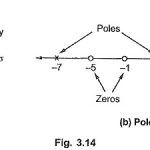
Pole Zero Plot: The variable s is a complex variable. Hence a complex plane is required to indicate the values of s graphically. A complex plane is a plane with X-axis as real axis and Y-axis as … (Read More)
Time Domain Response From Pole Zero Plot: From the locations of poles and zeros of the network function in the s-plane, the time response of the network can be perfectly identified. Let us study the various types of poles and their … (Read More)
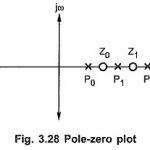
Evaluation of Residue Using Pole-zero Plot: The behavior of a network can be predicted only by looking at the pole-zero plot. The poles are the complex frequencies explaining the time responses. Also zeros are useful in finding partial fraction expansion. In … (Read More)