Insulation Coordination of Substation:
For steep fronted lightning waves at Insulation Coordination of Substation and at different points on lines, the voltages at sub-stations may exceed the protective level depending on the distances involved and the arrester locations. Hence, it is necessary to decide the number of locations for arresters to optimize the overall cost. For high voltage sub-stations, it is usual to instal surge arresters between a transformer and its circuit breaker, in order to protect the transformer from current chopping and the overvoltage due to it. Further, nearness of the arrester to the transformer offers better protection.
The basic Insulation Coordination of Substation is often determined by giving a margin of 30% to the protective level of surge arrester and selecting the next nearest standard BIL. The standard values of BIL for system voltages from 145 to 765 kV are given in ‘Tables 8.3 and 8.4. When a surge arrester is used to give switching surge protection also, the margin allowed is only 15%. The insulation level for lines and other equipment is to be chosen separately. The selection of this level for lines depends on the atmospheric conditions, the lightning activity, insulation pollution present and the acceptable outage or failure rate of the line.
The protective level of the Insulation Coordination of Substation depends on the station location, the protective level of the arrester, and the line shielding used. The line insulation in the end spans near the sub-station is normally reduced to limit the lightning overvoltages reaching the sub-station. In a Insulation Coordination of Substation, the busbar insulation level is the highest to ensure continuity of supply. The circuit breakers, isolators, instrument and relay transformers, etc. are given the next lower level. Since the power transformer is the costly and sensitive device, the insulation level for it is the lowest.
The illustrate the principles of Insulation Coordination of Substation, an example of a 132-kV sub-station is given below.
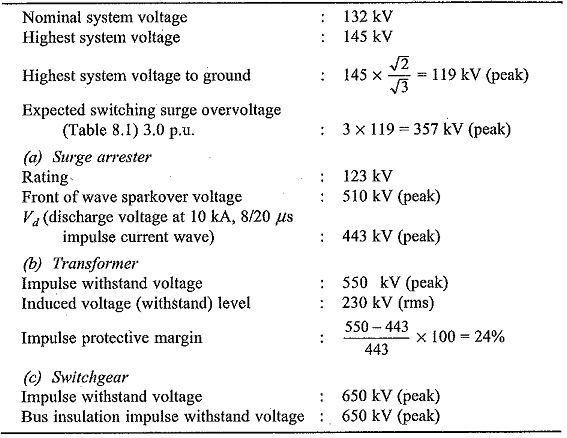
In case a rod gap is used for the protection of a transformer, the rod gap with a negative sparkover voltage of 440 kV (59 cm gap) may be chosen to give the 25% margin. The protection is good for surges having a front time not shorter than 2 μs. But the switching surge sparkover voltage which is about 380 kV is very near the maximum switching surge generated in the system and hence may cause many outrages. If a rod gap of 66 cm is used, the protection becomes doubtful, as the impulse sparkover voltage for 2 μs front wave is 600 kV.
Insulation Levels at Sub-stations with Protective Zones
Magnitude and Shape of the Incoming Voltage Surges
Direct strokes to phase conductors near the station point are very dangerous as they cause very high currents to flow through the surge arrester. The discharge voltages developed across the arrester elements are very high and the arresters may get destroyed. Therefore, the stations are completely shielded from direct strokes. The shielding is sometimes effected upto about 2 km on either side of the station. This protected zone gives the surges to originate only from outside regions. Usually the voltage wave at the station entrance is estimated by assuming a voltage magnitude at the beginning of the protected zone as equal to 1.3 times the negative critical flashover voltage of the line insulation. It is also important that the sloping off of the point of the surge is helpful for the effective performance of the surge arrester. Back flashovers are also important. There is a risk of a more severe surge occurring in the case of back flashovers. The probability of the occurrence of this depends on the rate of the back flashover of the protected zone and its length.
Equipment Insulation Level
For steep fronted travelling waves, the voltages at different points in the substation can exceed the protective level by amounts that depend on the distance from the arrester location, the steepness of the wave front and other electrical parameters. Hence, it is necessary to decide the number of locations at which surge arresters are to be located and their ratings. It necessary to keep this number to a minimum. Also, care must be taken regarding switching overvoltages generated due to current chopping which may destroy the transformer or the equipment near the circuit breakers. The Basic Impulse Level (BIL) is often determined as simply 1.25 to 1.30 times the protective level offered by the surge arrester. Usually, the next higher BIL value from the standard values is chosen. This is quite sufficient for smaller stations and station ratings up to 220 kV. For bigger stations and stations of importance, the “distance effect” discussed in the next section is to be suitably allowed for, when surge arresters are to be used for SIL also; a margin of 15 to 20% is normally allowed over the protective level. Distance effect is negligible for long fronted switching surges.
The Distance Effect
Usually the circuit breaker, the transformer and other equipment are placed at finite distances from the surge arrester and connected through a short distance over head line or cable. When a surge arises, it suffers multiple reflections between each of the equipment which may give rise to overvoltages of considerable magnitude (the travel time is usually less than a its). It can be shown that when a surge arrester, a breaker and a transformer are in line, the voltage that can build up at a distance D from the surge arrester point is given as V(D) = Vp + 2ST, where Vp is the sparkover voltage/protective level, S is the steepness of the wave front, and T is the travel time =D/v. Here, v is the velocity of the wave travel, assuming that the line extends to a large distance such that no reflections come from the line end. The maximum value of V(D) is attained when 2T= T0, the sparkover time of the arrester. The above simple expression shows that the transfer surge impedance is very high. The ratio of the transformer terminal voltage, VT to that of the protective level Vp is a function of (T/T0). For steep fronted waves, sometimes VT may exceed even 2 Vp. It has been shown that in a 330 kV sub-station a 1.2/50 μs, 1500 kV incoming wave can give rise to a surge of peak value 1250 kV having rise time of 2 μs at the bus terminals (neglecting the transfer capacitance), whereas the protective level offered by the surge arrester at the transformer terminal is only 750 kV. The transformer terminals may get a surge voltage of 930 kV peak. This has been verified by computer calculations for a 1/50 μs wave, on a line connected to a 330 kV station.
Insulation Co-ordination in EHV and UHV Systems
The insulation design of EHV and UHV stations is based on the following principles
- stations have transformers and other valuable equipment that have non-self restoring insulation, and
- the protective levels for lightning surges and switching surges are almost equal and even overlap. If the basic impulse level for the equipment or the system is chosen, then this level cannot give protection against the switching impulses. Hence, a separate switching impulse level (SIL) has to be chosen. It is, therefore, desirable to use protective devices for limiting both lightning and switching overvoltages. As such, the switching impulse Insulation Coordination of Substation above the controlled switching surge level has to be adopted so that the surge arresters operate only rarely on switching overvoltages when the controls of the control devices for switching voltages fail. A general guideline that can be adopted for different EHV and UHV system for maximum switching surge levels are given in Table 8.5.
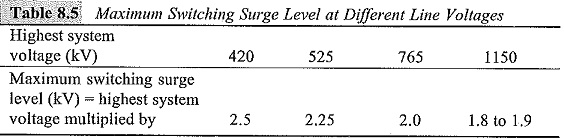
It is now necessary to allow a suitable margin in the Insulation Coordination of Substation above the maximum switching surge overvoltage and also permit a little risk for failure in the interest of economical adoption of insulation levels. Usually statistical methods are adopted based on a given risk of flashover which is calculated by combining the flashover voltage distribution function of the insulation structures with the oyervoltage probability density function.
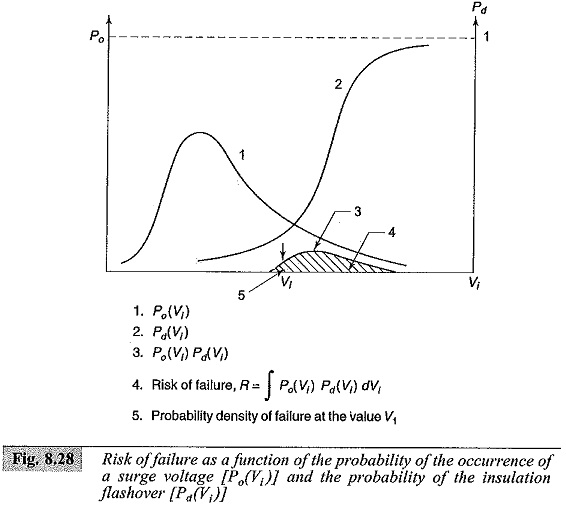
Let P0 (Vi) dVi be the probability of a surge voltage occurring as an overvoltage between Vi and (Vi + dVi). Let the probability for flashover of thd insulation be P0(Vi). Then probability of both the above events occurring simultaneously in Vi and ( V0 + Vi) will be given by P0(Vi) Pd(Vi). The risk of failure over the entire voltage range then becomes
![]()
If a number of insulation structures such as string of insulators are subjected to a switching surge, then the failure is adjusted for appropriate probability, considering all the individual probabilities simultaneously.
The risk of failure is graphically represented in Fig. 8.28.
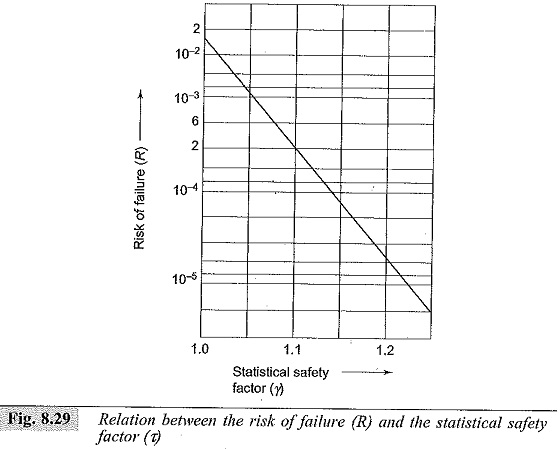
A simplified procedure to evaluate the risk of failure is given by the IEC which defines the safety factor as a ratio of the statistical overvoltage to that of statistical withstand voltage (T). The former voltage is the voltage likely to exceed 2% of all the overvoltages, while the latter is the 90% probability voltage for failure which is given as (CFO — 1.3 σ), where σ is the standard deviation of the overvoltage distribution function and CFO is the critical flashover voltage. A graph between the risk of failure and the statistical safety factor is given by the IEC and is shown in Fig. 8.29. It is evident from this figure that increasing the statistical safety factor will reduce the risk of failure but will cause an increase in the cost of insulation to be provided. For non-self restoring insulations like that of transformers, etc., the withstand voltage is expressed in terms of the breakdown voltage values.
The protective level provided by the protective devices like the surge arresters is established in the same manner as that for other apparatus, the difference being that the surge arresters must absorb the surge. The safety margin is arrived at by considering the risk factor R for the device used for the protection and the insulation structure to be protected, giving a safe margin.
In normal practice, the Insulation Coordination of Substation and the protective safety margin are arrived at by
- selecting the risk of failure R,
- the statistical safety factor,γ, and
- then fixing the withstand voltage and designing the insulation level of any equipment or apparatus corresponding to 90% or 95% of the withstand voltage thus fixed.
This type of approach may be understood as follows:
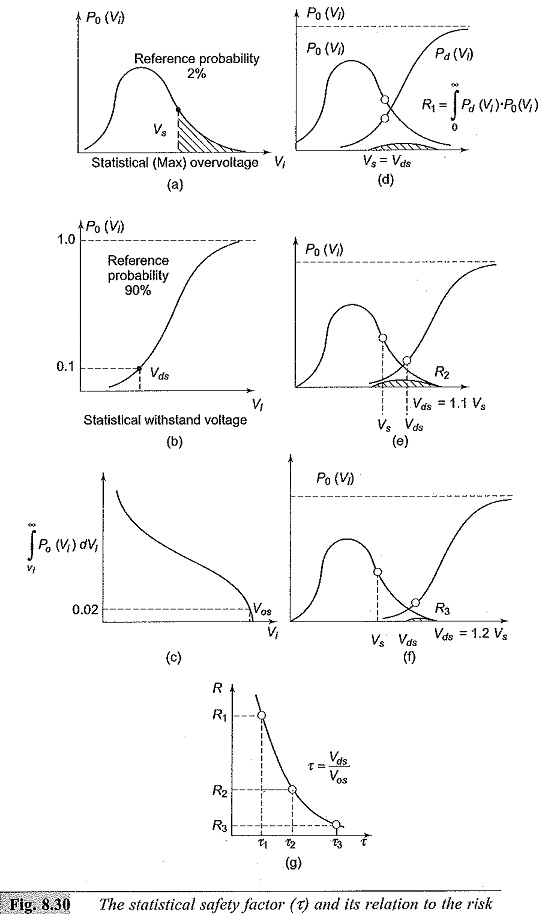
Let P0(Vi) represent the probability of occurrence of an overvoltage of magnitude Vos and has only 2% chance to cause the failure of the insulation. This voltage is known as statistical overvoltage. Let Vds be the voltage that causes only 10% or less breakdowns or failures, when applied to the insulation system. Also, let Pd(Vi) represent the statistical withstand voltage corresponding to the voltage Vds for the given insulation system. These probabilities are shown in Fig. 8.30. The statistical safety factor, τ defined earlier, is given as the ratio Vds/Vos. This statistical parameter τ, if increased, reduces the risk of failure R. This is illustrated in Fig. 8.30, where if the curve of the insulation flashover voltage [Pd(Vi)] if shifted towards the right, will increase the safety factor and reduce the risk of failure.
For proper Insulation Coordination of Substation, a certain margin of safety has to be provided by properly choosing the “protective level” the protective devices, such as spark gaps and surge arresters, and proper insulation level for the equipment and the apparatus. The correlation between the two is illustrated in Fig. 8.3 I.
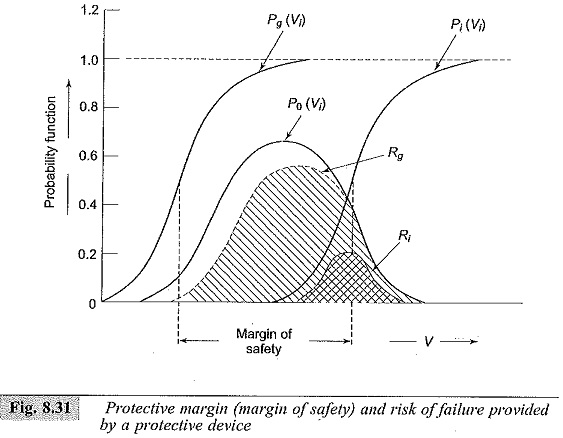
In the figure, Rg gives the risk factor for the protective gap with Pg(Vi) as its probability density function for failure and the overvoltage probability density function P0(Vi)occurring. The probability density function for insulation (to be protected) is given by Pi(Vi) and Ri is its risk factor. The safety margin which is the difference between Pg(Vi) and Pi(Vi) is also shown. In reality, this computation is not simple and deviation in the occurrence of overvoltages greatly influences the risk factors and the safe margin usually gets reduced.