Logarithmic Scale or Semi Log Graph Sheet:
To sketch the magnitude in dB and phase angle in degrees against Log ω, the logarithmic scale is used. This is available on semilog graph paper. In such paper the X-axis is divided into a logarithmic scale which is nonlinear one. While Y-axis is divided into linear scale and hence it is called semilog paper.
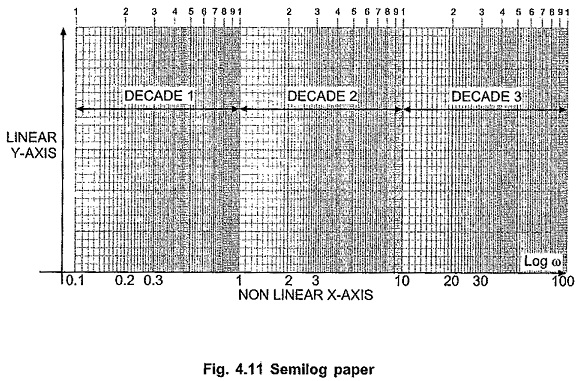
The interesting part about X-axis is the distance between 1 and 2 is greater than distance between 2 and 3 and so on. Similarly, on such scale, distance between 1 and 10 is equal to the distance between 10 and 100 or between 100 and 1000 and so on. This distance is called 1 decade.
This is because Log 1 = 0 and Log 10 = 1. The distance is 1 decade which is divided into 10 parts according to logarithmic scale i.e. Log 2, Log 3, ……
Now Log 10 = 1 and Log 100 = 2. The distance is again (2 – 1) i.e. 1 decade same as between Log 1 and Log 10, further divided into parts as Log 20, Log 30, ……
So X-axis is available, which is divided into two, three, or four such cycles i.e. decades.
So it is not necessary to find logarithmic value of ω but the logarithmic scale available takes care of logarithmic value of ω. The advantage of the scale is wide range of frequencies can be accommodated on a single paper.
As Log 0 = – ∞ it is obvious that X -axis cannot be calibrated from 0 but as per requirement the smallest frequency may be selected as starting frequency like 0.01, 0.1 etc. This hardly affects the result of the frequency response.
The Y axis is divided into linear scale, similar to standard graph paper.
To clear the idea of semilog paper and decade, the graph paper is shown in the Fig. 4.11.
The main advantage using the logarithmic representation is that the multiplication and division of magnitudes get replaced by the addition and subtraction respectively. The experimental determination of the transfer function is easier if frequency response data is presented in the form of the logarithmic plot. Such plot shows both low frequency and high frequency characteristics in the same diagram.