Noise Figure in Communication System:
The Noise Figure in Communication System are namely,
1.Signal to Noise Ratio:
The calculation of the equivalent noise resistance of an amplifier, receiver or device may have one of two purposes or sometimes both. The first purpose is comparison of two kinds of equipment in evaluating their performance. The second is comparison of noise and signal at the same point to ensure that the noise is not excessive. In the second instance, and also when equivalent noise resistance is difficult to obtain, the signal-to-noise ratio S/N is very often used. It is defined as the ratio of signal power to noise power at the same point. Therefore

Equation (2-10) is a simplification that applies whenever the resistance across which the noise is developed is the same as the resistance across which signal is developed, and this is almost invariable. An effort is naturally made to keep the signal-to-noise ratio as high as practicable under a given set of conditions
2.Definition of Noise Figure in Communication System:
For comparison of receivers or amplifiers working at different impedance levels the use of the equivalent noise resistance is misleading. For example, it is hard to determine at a glance whether a receiver with an input impedance of 50 Ω and Req = 90 Ω is better, from the point of view of noise, than another receiver whose input impedance is 300 Ω and Req= 400 Ω. As a matter of fact, the second receiver is the better one, as will be seen. Instead of equivalent noise resistance, a quantity known as Noise Figure in Communication System, sometimes called noise factor, is defined and used. The noise figure F is defined as the ratio of the signal-to-noise power supplied to the input terminals of a receiver or amplifier to the signal-to-noise power supplied to the output or load resistor. Thus

It can be seen immediately that a practical receiver will generate some noise, and the S/N will deteriorate as one moves toward the output. Consequently, in a practical receiver, the output S/N will be lower than the input value, and so the noise figure will exceed 1. However, the noise figure will be 1 for an ideal receiver, which introduces no noise of its own. Hence, we have the alternative definition of noise figure, which states that F is equal to the S/N of an ideal system divided by the S/N at the output of the receiver or amplifier under test, both working at the same temperature over the same bandwidth and fed from the same source. In addition, both must be linear. The noise figure may be expressed as an actual ratio or in decibels. The Noise Figure in Communication System of practical receivers can be kept to below a couple of decibels up to frequencies in the lower gigahertz range by a suitable choice of the first transistor, combined with proper circuit design and low-noise resistors. At frequencies higher than that, equally low-noise figures may be achieved (lower, in fact) by devices which use the transit-time effect or are relatively independent of it.
3.Calculation of Noise Figure:
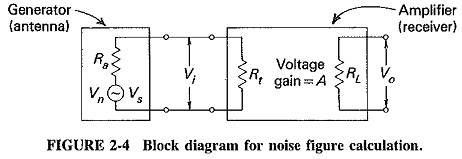
Noise Figure in Communication System may be calculated for an amplifier or receiver in the same way by treating either as a whole. Each is treated as a four-terminal network having an input impedance Rt, an output impedance RL, and an overall voltage gain A. It is fed from a source (antenna) of internal impedance Ra, which may or may not be equal to Rt as the circumstances Warrant. A block diagram of such a four-terminal network (with the source feeding it) is shown in Figure 2-4.
The calculation procedure may be broken down into a number of general steps. Each is now shown, followed by the number of the corresponding equation(s) to follow:
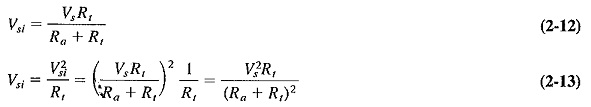
- Determine the signal input power Psi (2-12, 2-13).
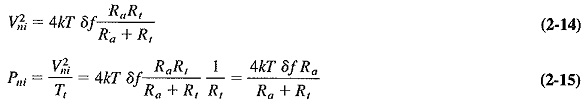
- Determine the noise input power Pni (2-14, 2-15).
- Calculate the input signal-to-noise ratio S/Ni from the ratio of Psi and Pni (2-16).
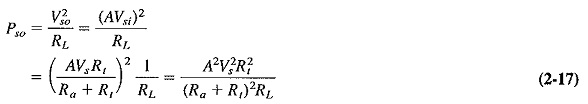
- Determine the signal output power Pso (2-17).
- Write Pno for the noise output power to be determined later (2-18).
- Calculate the output signal-to-noise ratio S/No from the ratio of Pso and Pno (2-19).
- Calculate the generalized form of noise figure from steps 3 and 6 (2-20).
- Calculate Pno from Req if possible (2-21, 2-22), and substitute into the general equation for F to obtain the actual formula (2-23, 2-24), or determine Pno from measurement (2-3, 2-25, 2-26), and substitute to obtain the formula for F (2-27, 2-28, 2-29).
It is seen from Figure 2-4 that the signal input voltage and Power will be
Similarly, the noise input voltage and power will be
The input signal-to-noise ratio will be

The output signal power will be
The noise output power may be difficult to calculate. For the time being, it may simply be written as
![]()
The output signal-to-noise ratio will be

Finally , the general expression for the Noise Figure in Communication System is
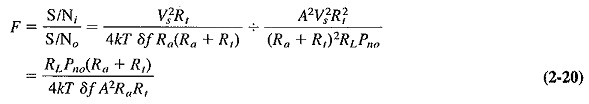
Note that Equation (2-20) is an intermediate result only. An actual formula for F may now be obtained by substitution for the output noise power, or from a knowledge of the equivalent noise resistance, or from measurement.
4.Noise Figure from Equivalent Noise Resistance:
As derived in Equation (2-7), the equivalent noise resistance of an amplifier or receiver is the sum of the input terminating resistance and the equivalent noise resistance of the first stage, together with the noise resistances of the previous stages referred to the input. Putting it another way, we see that all these resistances are added to Rt, giving a lumped resistance which is then said to concentrate all the “noise making” of the receiver. The rest of it is now assumed to be noiseless. All this applies here, with the minor exception that these noise resistances must now be added to the parallel combination of Ra and Rt. In order to correlate noise figure and equivalent noise resistance, it is convenient to define R′eq, which is a noise resistance that does not incorporate Rt and which is given by
![]()
The total equivalent noise resistance for this receiver ill now be

The equivalent noise voltage generated at the input of the receiver will be
![]()
Since the amplifier has an overall voltage gain A and may now be treated as though it were noiseless, the noise output will be
When Equation (2-22) is substituted into the general Equation (2-20), the result is an expression for the Noise Figure in Communication System in terms of the equivalent noise resistance, namely,
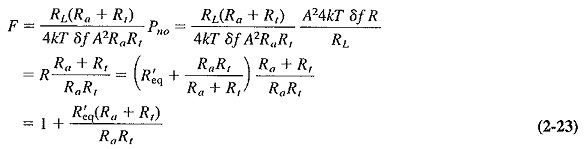
It can be seen from Equation (2-23) that if the noise is to be a minimum for any given value of the antenna resistance Ra, the ratio (Ra + Rt)/Rt must also be a minimum, so that Rt must be much larger than Ra. This is a situation exploited very often in practice, and it may now be applied to Equation (2-23). Under these mismatched conditions, (Ra + Rt)/Rt approaches unity, and the formula for noise figure reduces to
![]()
This is a most important relationship, but it must be remembered that it applies under mismatched conditions only. Under matched conditions (Rt = Ra) or when the mismatch is not severe, Equation (2-23) must be used instead.
Note that if an “equivalent noise resistance” is given without any other comment in connection with noise figure calculations, it may be assumed to be R′eq.
5.Noise Figure from Measurement:
The preceding section showed how the noise figure may be computed if the equivalent noise resistance is easy to calculate. When this is not practicable, as under transit-time conditions, it is possible to make measurements that lead to the determination of the Noise Figure in Communication System. A simple method, using the diode noise generator, is often employed. It is shown in Figure 2-5 in circuit-block form.
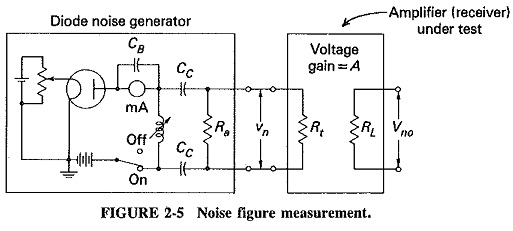
Equation (2-3) gave the formula for the exact plate noise current of a vacuum-tube diode, and this can now be used. As shown, the anode current is controlled by means of the potentiometer which varies filament voltage, and that is how shot-noise current is adjusted.
The output capacitance of the diode and its associated circuit is resonated at the operating frequency of the receiver by means of the variable inductance, so that it may be ignored. The output impedance of the noise generator will now simply be Ra. The noise voltage supplied to the input of the receiver by the diode will be given by

The noise generator is connected to the receiver (or amplifier) under test, and the noise output power of the receiver is measured with zero diode plate current, i.e., with the diode plate voltage supply switched off. The diode plate voltage supply is now switched on, and the filament potentiometer is adjusted so that diode plate current begins to flow. It is further adjusted until the noise power developed in RL is twice as large as the noise power in the absence of diode plate current. The plate current at which this happens, ip, is measured with the milliamnieter and noted. The additional noise power output is now equal to the normal noise power output, so that the latter can be expressed in tennis of the diode plate current. We now have

As already outlined, Equation (2-26) may be substituted into Equation (2-20).
This yields
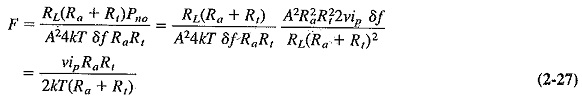
If it is assumed once again that the system is mismatched and Rt ≫ Ra, Equation (2-27) is simplified to
![]()
If the above procedure is repeated right from the beginning for a system under matched conditions, it may then be proved that Equation (2-28) applies exactly to such a system instead of being merely a good approximation, as it is here. Such a result emphasizes the value of the noise diode measurement.
As a final simplification, we substitute into Equation (2-28) the values of the various constants it contains. These include the standard temperature at which such measurements are made, which is 17°C or 290 K. This gives a formula which is very often quoted:
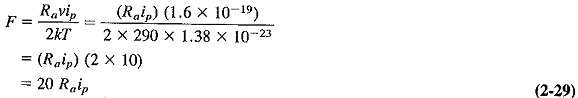
where Ra is measured in ohms and ip in amperes.