Block Diagram of Electric Drive System:
It is normal practice in control engineering to represent a control system by means of a Block Diagram of Electric Drive System, with a systematic connection of blocks in the direction of signal flow, showing the functions performed by each component of the system. A control system is dynamic and its performance is represented by a set of differential equations. Each component is represented by a block having a definite input-output relation. In effect a block diagram is a graphical representation of the basic equations of a physical system. The direction of signal flow is specified and each block is unidirectional, arrow heads in the diagram representing signal flow.
The drive system employing the principles of feedback control theory also have several components performing individual functions (Fig. 6.1). An electric motor drives the mechanical load. The motor is supplied from a thyristor power converter. The converter has necessary controls to provide the required supply to the motor, e.g., variable voltage variable frequency supply, if the drive motor is ac motor. In addition to these there are speed and current controllers and limiters in the systems. Furthermore, there are devices for speed and current measurement. Therefore, the system can be advantageously divided into several parts, each part being represented by a block. All the blocks are interconnected.

The drive system with all its components may be represented by a set of differential equations which describe the dynamic and steady-state behaviour. When once it is represented by a block diagram, each block having its own input-output relationship, it gives a valuable insight into the nature of the system. The system simplification using block diagram reduction techniques is very easy. The process is mechanical and yields a single overall block to represent the performance of the system. All the blocks being unidirectional are connected in the direction of signal flow. The block diagram, therefore indicates realistically the flow of signals, apart from representing the system by a mathematical model. It is an easy representation to obtain the information regarding the dynamic behaviour. However it does not give any information about the physical nature of the system. A single block diagram may represent different dissimilar unrelated systems.
The system analysis utilizing the method of block diagram reduction gives a better understanding of the system and the contribution of each component to the performance of the system. It is therefore logical to expect an improvement or alteration in the system performance by changing the input-output relation of one or several blocks. Sometimes new blocks may be added to improve the performance. The process is rather easier than manipulating machine equations.
However, only linear systems may be represented by a block diagram. The drive systems invariably have non-linear elements. These have to be linearised about an operating point to be able to apply the block diagram techniques.
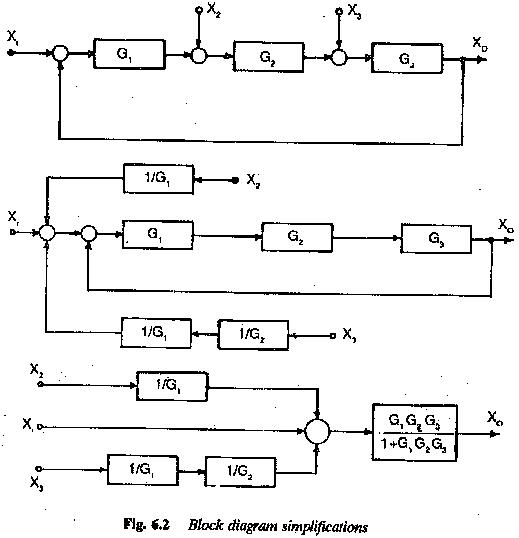
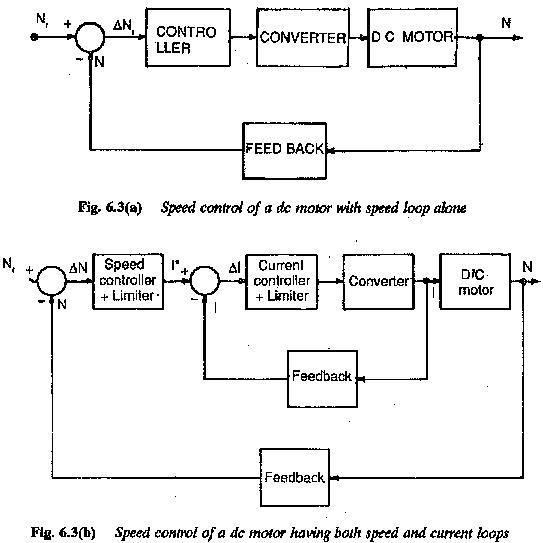
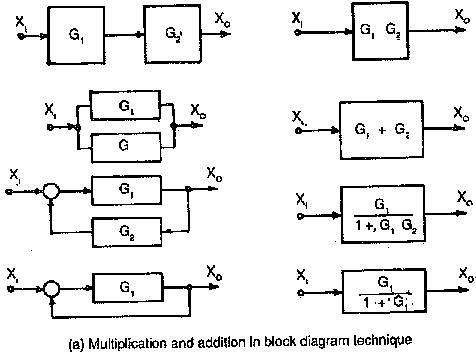
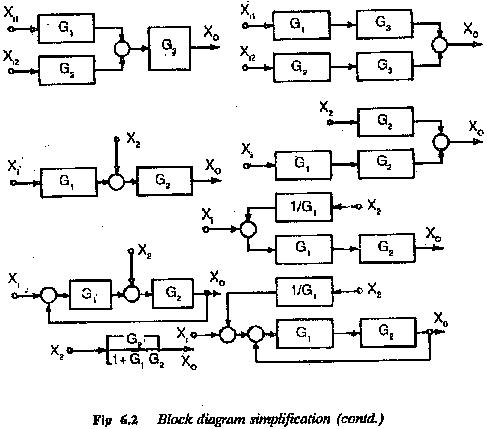
Figure 6.2 summarises various reduction techniques of block diagram for simplification of the system. The block diagram of a typical dc motor speed control system is given in Fig. 6.3.