Experimental Arrangement to Measure Ionization Coefficients α and γ:
The Experimental Arrangement to Measure Ionization Coefficients is shown in Fig. 2.2. The electrode system consists of two uniform field electrodes. The high voltage electrode is connected to a variable high voltage d.c. source (of 2 to 10 kV rating). The low voltage electrode consists of a central electrode and a guard electrode. The central electrode is connected to the ground through the high resistance of an electrometer amplifier having an input resistance of 109 to 1013 ohms. The guard electrode is directly earthed. The electrometer amplifier measures currents in the range 10-14 to 10-8 A.
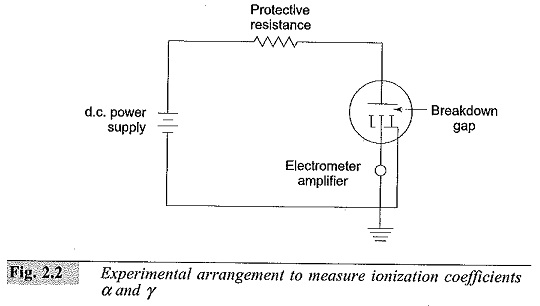
The electrode system is placed in an ionization chamber which is either a metal chamber made of chromium plated mild steel or stainless steel, or a glass chamber. The electrodes are usually made of brass or stainless steel. The chamber is evacuated to a very high vacuum of the order of I0-4 to 10-6 torr. Then it is filled with the desired gas and flushed several times till all the residual gases and air are removed. The pressure inside the chamber is adjusted to a few torr depending on the gap separation and left for about half an hour for the gas to fill the chamber uniformly.
The cathode is irradiated using an ultra-violet (U.V.) lamp kept outside the chamber. The U.V. radiation produces the initiatory electrons (n0) by photo electric emission.
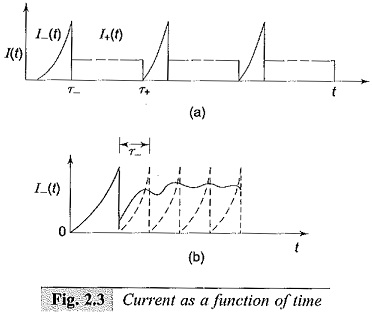
When the d.c. voltage is applied and when the voltage is low, the current pulses start appearing due to electrons and positive ions as shown in Figs 2.3a and 2.3b. These records are obtained when the current is measured using a cathode ray oscilloscope.
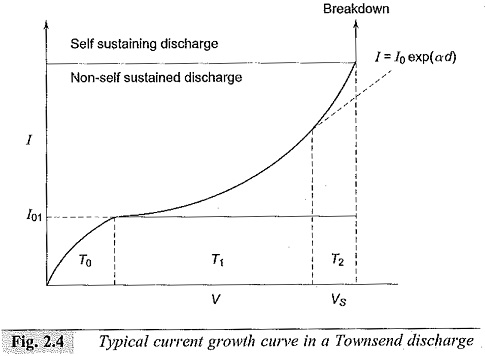
When the applied voltage is increased, the pulses disappear and an average d.c. current is obtained as shown in Fig. 2.4. In the initial portion (T0), the current increases slowly but unsteadily with the voltage applied. In the regions T1 and T2, the current increases steadily due to the Townsend mechanism. Beyond T2 the current rises very sharply, and a spark occurs.
- When secondary electrons are produced at the cathode by positive
- When secondary electrons are produced by photons at the cathode.
For determining the α and γ Ionization Coefficients, the voltage-current characteristics for different gap settings are obtained. From these results, a log I/I0 versus gap distance plot is obtained under constant field (E) conditions as shown in Fig. 2.5. The slope of the initial portion of the curves gives the value of α. Knowing α, γ can be found from Eq. (2.20) using points on the later upturn portion of the graphs. The experiment can be repeated for different pressures.
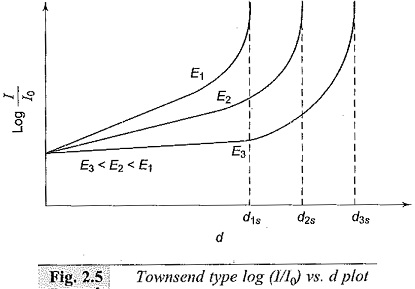
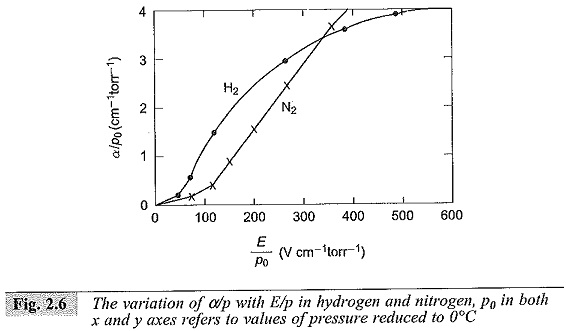
It can be easily seen that α/p and γ are functions of E/p. The spark-over voltage for any gap length ds is Vs = Eds where ds is the critical gap length for that field strength as obtained from the graph. It may be noted that if I0, the initial current, is more, the average anode current I will also be more, and the relation log I/I0 versus d plot remains the same. Typical variation of α is shown in Fig. 2.6.