Digital Fourier Analyzer:
The basic principle of a Digital Fourier Analyzer is shown in Fig. 9.14. The Digital Fourier Analyzer converts the analogue waveform over time period T into N samples.
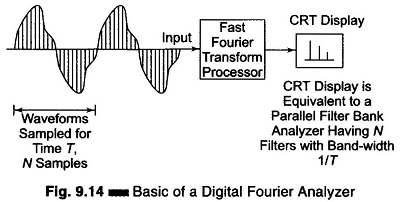
The discrete spectral response Sx (k Δ f); k = 1, 2,…, N which is equivalent to simultaneously obtaining the output from N filters having a bandwidth given by Δf = 1/T, is obtained by applying a Discrete Fourier Transform (DFT) to the sampled version of the signal. The spectral response is thus given by
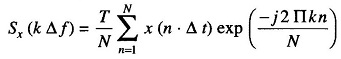
where k = 1, 2, 3,…., N.
Sx (k Δ f) is a complex quantity, which is obtained by operating on all the sample x (n · Δt); n = 1, 2, 3,…, N by the complex factor exp [-j[(2Πkn)/N]].
The discrete inverse transform is given by
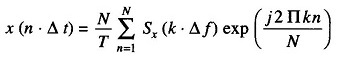
where n = 1, 2, …, N.
Since Sx (k · Δ f); k = 1, 2, …, N is a complex quantity, the DFT provides both amplitude and phase information at a particular point in the spectrum.
The discrete transforms are usually implemented by means of the Fast Fourier Transform (FFT), which is particularly suitable for implementation in a digital computer, since N is constrained to the power of 2, i.e. 210 = 1024.
A digital signal analyzer block diagram is shown in Fig. 9.15. This digital signal analyzer employs an Fast Fourier Transform algorithm.
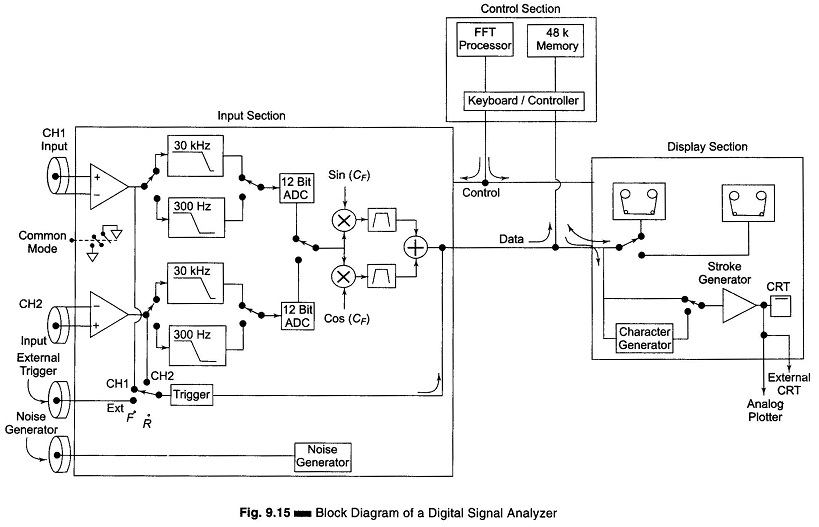
The block diagram is divided into three sections, namely
- the input section,
- the control section and
- the display section.
The input section consists of two identical channels. The input signal is applied to the input amplifier, where it is conditioned and passed through two or more anti-aliasing filters. The cut-off frequencies of these filters are selected with respect to the sampling frequency being used. The 30 kHz filter is used with a sampling rate of 102.4 kHz and the 300 kHz filter with a sampling rate of 1.024 MHz.
To convert the signal into digital form, a 12 bit ADC is used. The output from the ADC is connected to a multiplier and a digital filter.
Depending on the mode of the analyzer to be used, either in Base-band mode (in which the spectrum is displayed from a dc to an upper frequency within the bandwidth of the analyzer) or in the band selectable mode (which allows the full resolution of the analyzer to be focused in a narrow frequency band), the signal is multiplied either by a sine or cosine function.
The processing section of the analyzer provides FFT processing on the input signal (linear or logarithm).
For one channel this can provide the real (magnitude) and imaginary (phase) of the linear spectrum Sx (f) of a time domain signal
![]()
where F(x (t)) is the Fourier transform of x(t).
The autospectrum Gxx (f) which contains no phase information is obtained from Sx (f) as
![]()
where Sx (f)* indicates the complex conjugate of Sx (f).
The Power Spectral Density (PSD) is obtained by normalizing the function Gxx (f) to a bandwidth of 1 Hz, which represents the power in a bandwidth of 1 Hz centered around the frequency f.
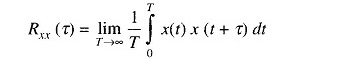
The Inverse Fourier Transform of Gxx (f) is given by
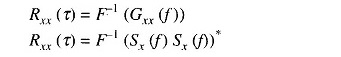
writing the above equation in terms of the time domain characteristics of the signal x(t), its autocorrelation function is defined as
By the use of two channels, the combined properties of the two signals can be obtained. The cross-power spectrum of the two signals x(t) and y(t) can be computed as
![]()
where Sy (t) is the linear spectrum of y(t) and Sx(t)* is the complex conjugate spectrum of x(t).
If x(t) represents the input to a system and y(t) the output of the system, then its transfer function H(f), which contains both amplitude and phase information can be obtained by computing
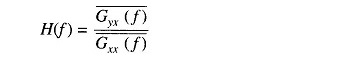
where the bars indicate the time averaged values.
The input signal used for such measurements is often the internal random noise generator.